Let's compare TRX and ETH Satoshi charts 🤔
For crypto newbies, 1 Satoshi means 0.00000001 BTC. So, Satoshi chart means BTC exchange ratio of a crypto.
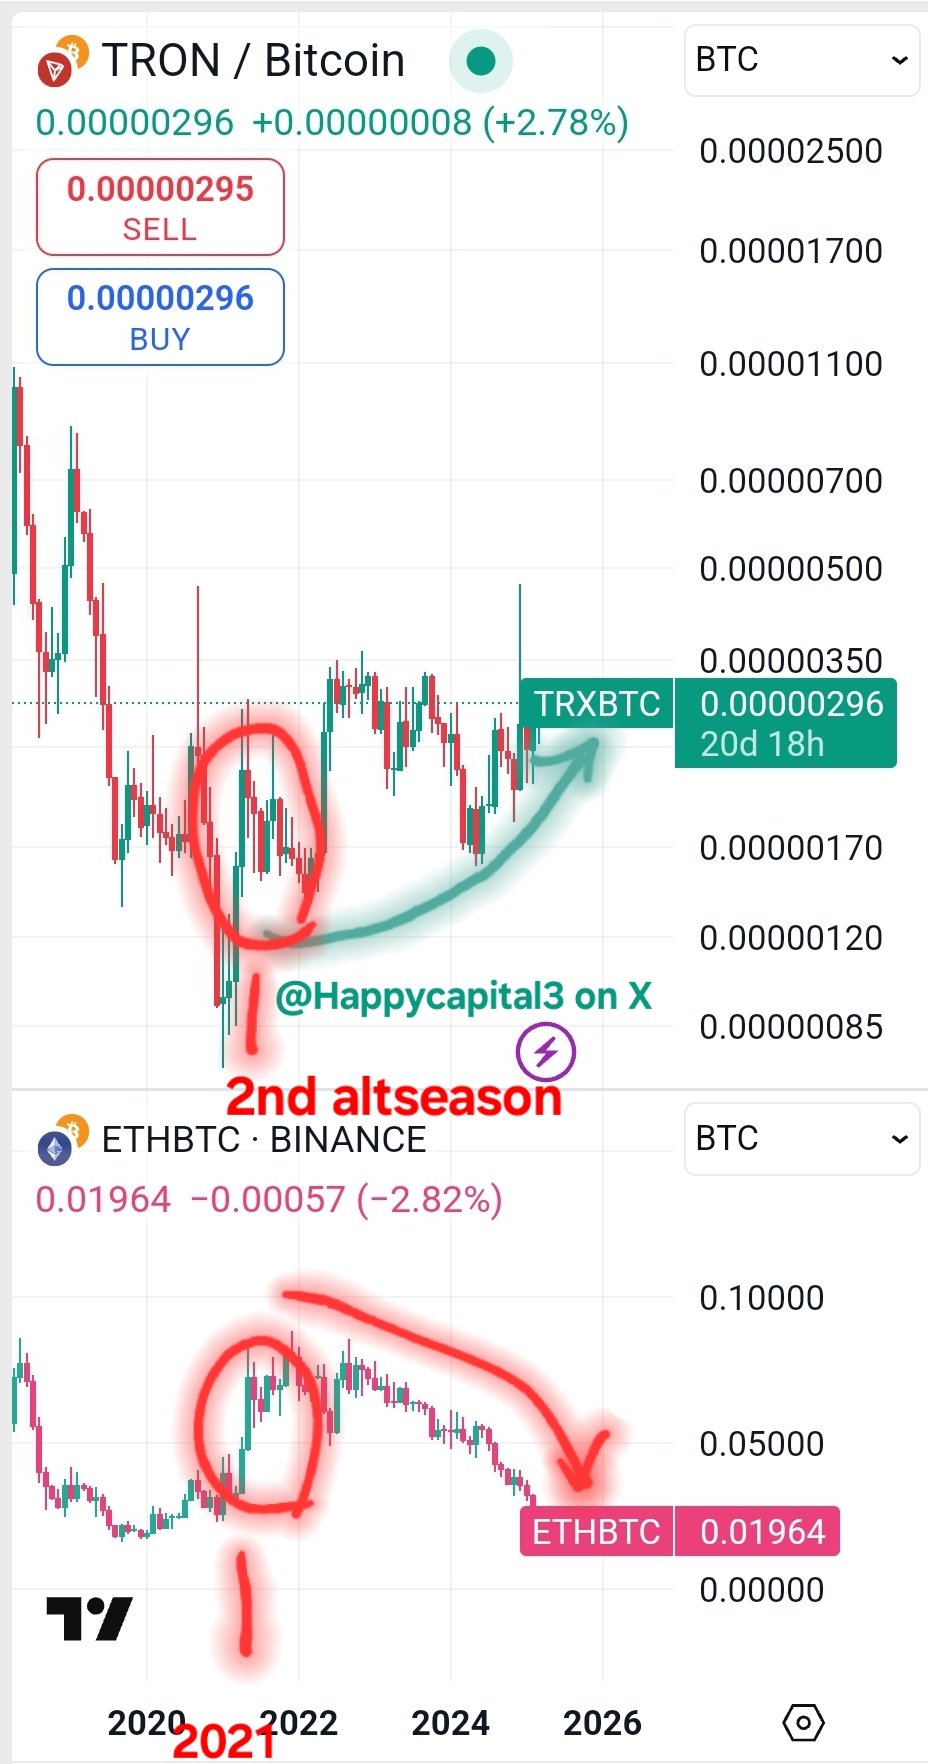
I just wondered TRX Satoshi price performance for the past 7 years. As you know, the 2nd altseason started since February 2021. Then, the 1st top formed in April 2021. After that, the 2nd top formed in November 2021.
Since 2021, TRX Satoshi price has maintained the uptrend for the past 4 years. The reasons why TRX could maintain such an uptrend are Keep building and Continuous development such as SunPump, NFTPump, and so on.

Justin Sun mentioned spot TRX ETF. If it launches in the U.S., I expect the positive price movement of TRX with respect to the TRX/BTC Satoshi chart.