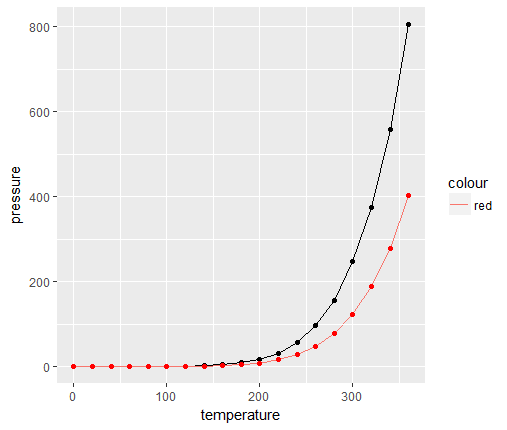
Drawing line and point graphs in ggplotsouth-man (32)in #ggplot • 7 years ago library(ggplot2) ggplot(pressure, aes(x=temperature, y=pressure)) + geom_line() + geom_point() + geom_line(mapping = aes(y=pressure/2, colour="red")) + geom_point(mapping = aes(y=pressure/2), colour="red") #r #line #point