CADJPY: Is This The Beginning of The Bullish Trend? | Forex Analysis
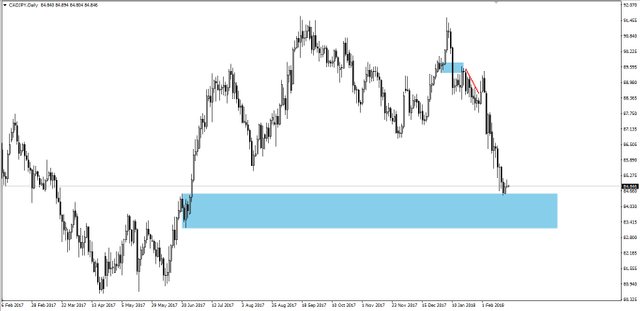
Since two days ago, the price of this pair has touched a very strong demand area or Flag Limit area on the daily chart. See the chart below:

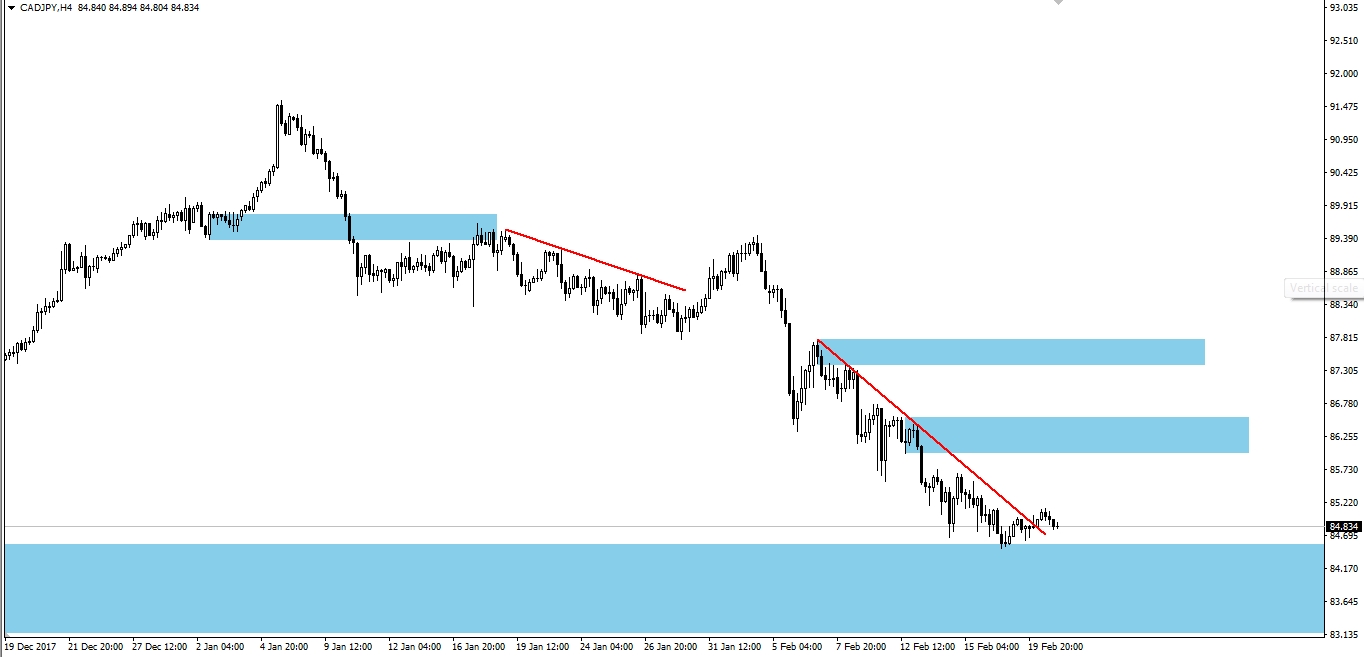
In addition, on the H4 chart, there is also a trendline line that has been passed by CADJPY price.

From the chart, if you decide to execute the buy, you can buy it at the current price (84.840) with the first TP at 86.00 and SL at 84.40. What if the price breaks through 84.40? So, I will wait and will most likely decide to execute buy again at the end of that flag limit area, around 83.20 - 82.35.
Remember! this is my view, you can agree or disagree with my view and also remember trading derivatives carries a high level of risk to your capital and you should only trade with money you can afford to lose. Trading Derivatives may not be suitable for all investors.
Where/how do you get the blue squares?
Sorry for my late reply, the blue square on the first chart is called flag limit area when the price breaks the supply/demand area on the left and then the price makes sideways area. I learn from this man, https://www.youtube.com/channel/UCh4HXz7yqlHUHmNGjqh1z-Q
The blue squares on the second chart are only supply area, and as many price action supply-demand traders know, this area is very subjective, depending on your view.
Congratulations @auliaafzal! You received a personal award!
Click here to view your Board
Congratulations @auliaafzal! You received a personal award!
You can view your badges on your Steem Board and compare to others on the Steem Ranking
Vote for @Steemitboard as a witness to get one more award and increased upvotes!