Ether Price Analysis: Market Consolidation Provides Calm Before Next Breakout
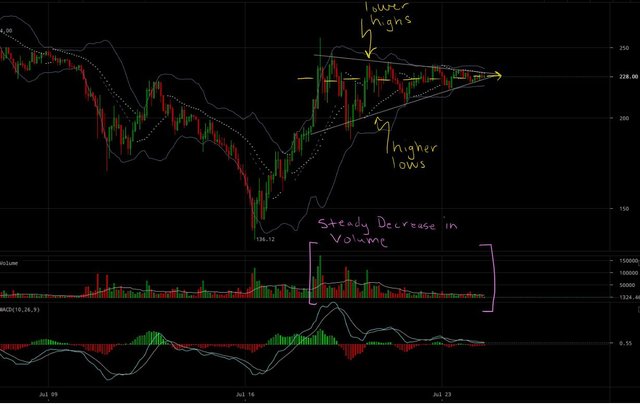
Over the past few days, despite major swings throughout the crypto-market, ETH-USD finally appears to be displaying nice, reliable signs of market consolidation:
Figure 1: ETH-USD, 2-hr Candles, Bitfinex, Consolidation Pattern
Two key characteristics of market consolidation are decreasing volume over the course of a trend and decrease in price volatility. It should be noted that price consolidation can take many patterns and is not restricted to the convergent pattern (lower highs accompanied by higher lows) displayed above. For the sake of this article, we will focus on the convergent pattern displayed in our current market. To see the health of the overall market, let’s put this trend in the context of the weeks leading up to this pattern:
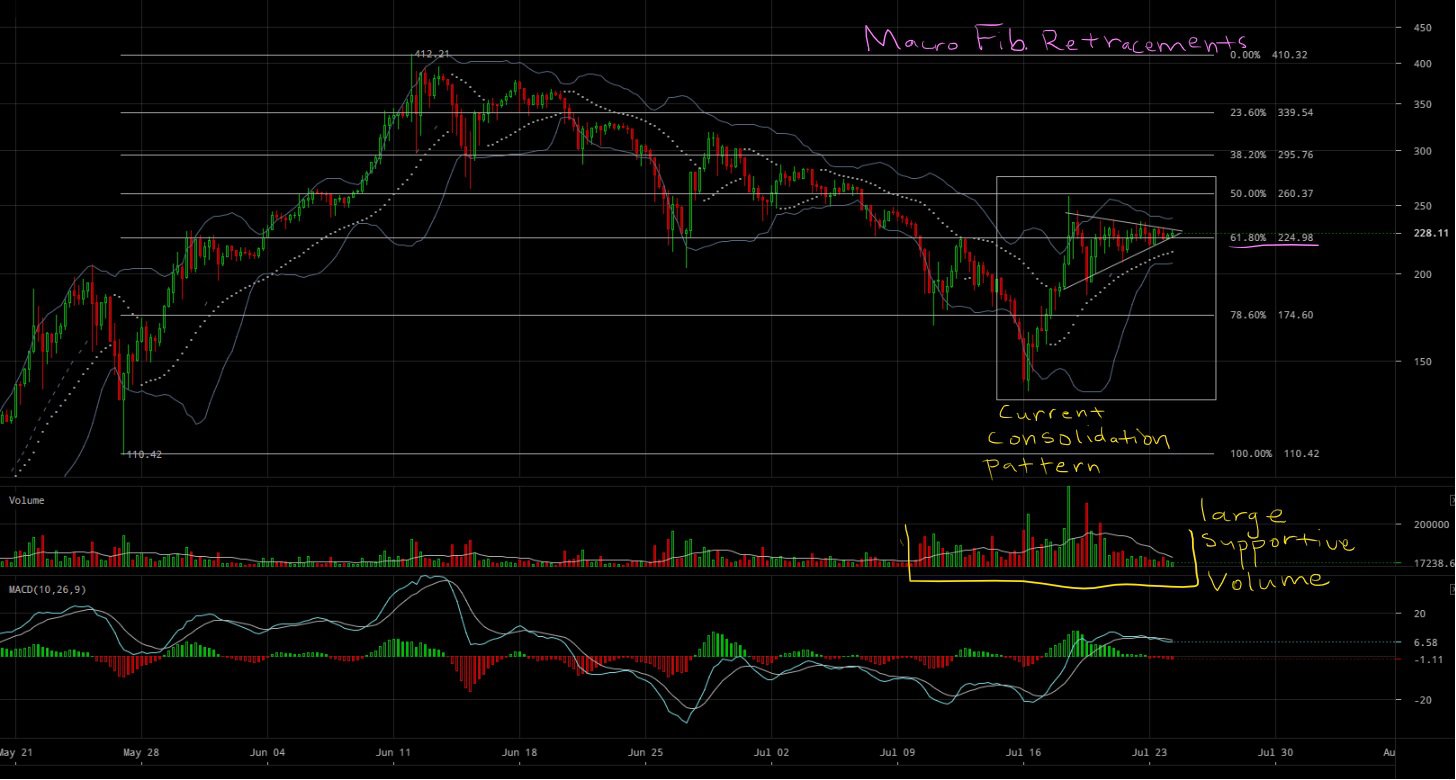
Figure 2: ETH-USD, 6-hr Candles, Bitfinex, Macro Fibonacci Retracement Values
Within the context of the macro trend, our consolidation pattern falls very neatly on the 60 percent Fibonacci Retracement values of the macro bull trend that brought us to our all-time high values. When looking at the health of this trend, the first thing that pops out is the large amount of supportive volume (shown in yellow) that has gone into shaping the current ETH-USD volume. The current volume trend far outweighs any of the previous volume trends throughout the life of the bear market and even throughout the life of the previous bull run that led to all-time high values.
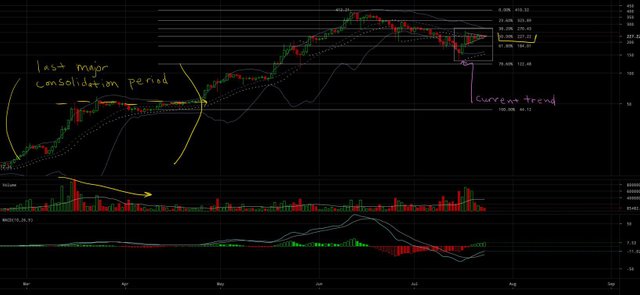
If we zoom out even further, we can see our current volume is actually at the highest volume the market has seen since its last major consolidation period within the $40 values:
Figure 3: ETH-USD, 1-Day Candles, Log Scale, Bitfinex, Last Major Consolidation Period
The previous consolidation period (shown in yellow) resulted in a substantial Bull Pennant pattern that resulted in a bull run that doubled the market value of ETH-USD. Something interesting to note is our current consolidation pattern within the context of the entire market since the last consolidation pattern. If we look at the market moves post-consolidation as a massive bull run — which, technically, it is — we see ETH-USD is consolidating very nicely on the 50 percent Fibonacci Retracement values.
Although the price projections for our current consolidation period is substantially lower than the last major consolidation period, the important aspect to take away from Figure 3 is the magnitude of the volume the market has experienced over the past couple weeks. High volume leading into a consolidation period is a good sign that the market has found its bottom and is now gathering up support and investor confidence before a breakout.
There are two ways to view our current consolidation pattern:
An agnostic (meaning it’s neither bullish-leaning nor bearish-leaning), symmetrical triangle;
A Bull Pennant (a bullish continuation pattern).
For the sake of time, I won’t go into details regarding how to calculate the price targets of these patterns. Both symmetrical triangles and Bull Pennants are very commonly traded patterns and have a lot of literature to support their price targets. If this pattern turns out to be a symmetrical triangle and the consolidation breaks down, we can most likely expect a move down to the $180 range before any further upward movement is seen.
However, if this is a Bull Pennant, ETH-USD can most likely expect a ~$100 move upward, leading to a price target of approximately $330. It’s important to note that a price target of $330 would result in a 100 percent retracement since the beginning of our prior bear run. If the market breaks upward and we do see a $330 price target, a test of this 100 percent retracement value will be crucial to determine the future moves within the ETH-USD markets.
Summary:
ETH-USD has spent days consolidating along $230.
A breakout upward would most likely yield a $330 price target.
A breakout downward would most likely yield a $180 price target.
Trading and investing in digital assets like bitcoin and ether is highly speculative and comes with many risks. This analysis is for informational purposes and should not be considered investment advice. Statements and financial information on Bitcoin Magazine and BTC Media related sites do not necessarily reflect the opinion of BTC Media and should not be construed as an endorsement or recommendation to buy, sell or hold. Past performance is not necessarily indicative of future results.
Kindly Follow me @ememovic
Upvote 💖
Resteem
And Comment 👇


Hi! I am a robot. I just upvoted you! I found similar content that readers might be interested in:
http://www.nasdaq.com/article/ether-price-analysis-market-consolidation-provides-calm-before-next-breakout-cm820523
First reply on steem! Great analysis. This consolidation period should get to an end at the beggining of the month when Bitcoin will lead the way. Let's don't forget that ETH isn't still just supporting himself and the Bitcoin direction will still drive ETH up or down.
Let's see what direction that will be and ETH will follow.
Thanks for commenting. Kindly upvote this post. 👍