ETH/USD & EUR Price Analysis: April 24 Can Ethereum Bounce Back?
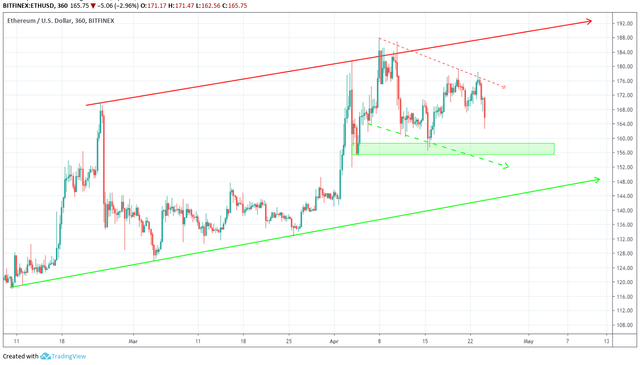
At Bittabi, we offer regular price analyses and predictions of the most popular and relevant cryptoassets. In our Apr 22 analysis of Ethereum (ETH) we predicted that the price of Ethereum would decrease. Our prediction was validated on Apr 24, when the price reached the support area we have defined below. To learn more read our latest ETH/USD($) and ETH/EUR(€) analysis below:
On Apr 8, 2019, the price of Ethereum (ETH) made a high of $187.98 & €167.32. A sharp drop followed. Lows of $156.42 & €138.36 were reached on Apr 15.
The price began to increase, reaching highs close to $180 and €160 on Apr 23. It has been decreasing since.
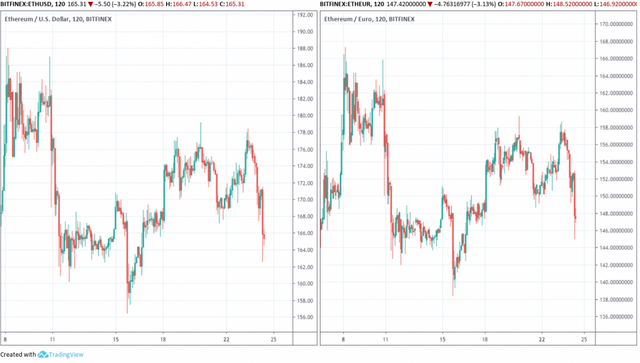
Will the price of Ethereum keep falling?
Let’s find out:
Ethereum (ETH): Trends and Highlights for April 24, 2019
- The price of Ethereum has been on a downtrend since Apr 8.
- It is trading inside a descending channel.
- Bearish divergence is developing in the RSI and the MACD.
- There is support near $156 and €140.
Descending Channel
In this section, we define Ethereum’s current trading pattern by analyzing the price of ETH/USD on Bitfinex at two-hour intervals from Apr 8 to Apr 24. In order not to create confusion, we will not be using images of the ETH/EUR pair until the summary, where the relevant resistance and support areas will be shown in euros and dollars.
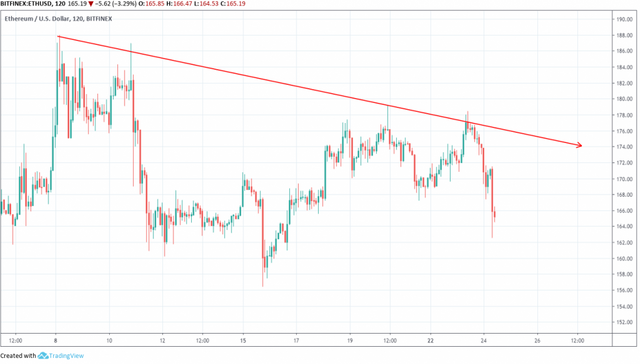
On Apr 8, Ethereum reached an hourly high of $187.78. A sharp decrease was followed by a gradual increase.
The price has made several lower highs. Tracing these highs gives us a descending resistance line:
On Apr 6, the price reached a low of $161.71. Several market cycles have been completed and the price has created lower lows each time. Tracing these lows gives us a descending support line.
The support and resistance lines combine to create a descending channel:
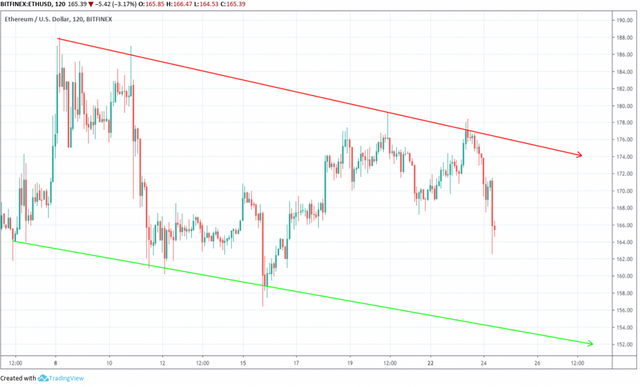
It is likely that the price will trade inside the confines of the channel until a decisive move occurs.
To predict the direction of the move, we need to take a look at a longer time-frame combined with technical indicators.
Technical Indicators
The price of ETH is analyzed at six-hour intervals from Feb to Apr 24 alongside the RSI and the MACD.The relative strength index (RSI) is an indicator which calculates the size of the changes in price in order to determine oversold or overbought conditions in the market.The moving average convergence divergence (MACD) is a trend indicator that shows the relationship between two moving averages (long and short-term) and the price. It is used to measure the strength of a move.
Combining RSI bullish/bearish divergence with support/resistance essentially predicts price fluctuations. They are shown in the chart below:
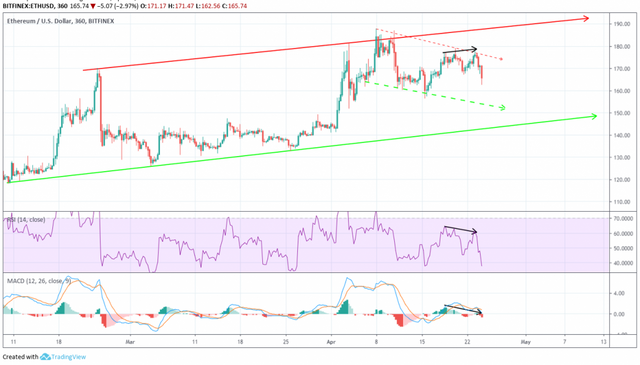
On Apr 18, the price made a high of $174.10. It continued to increase and made a high of $176 on Apr 13.
Similarly, the RSI and the MACD made the first high on Apr 18. However, they continued to generate lower values.
This is known as bearish divergence and often precedes price decreases.
Furthermore, we can see that the price has been trading inside an ascending channel since Feb 10.
Using these indicators, it is likely that the price will decrease and eventually fall down to the support line of the channel.
Reversal Areas
To determine possible price levels following a decrease, we continue with an analysis of support areas.Support areas are created when the price revisits the same level several times. They indicate the levels price might reach in the future based on past patterns.They are shown for ETH/USD and ETH/EUR below:
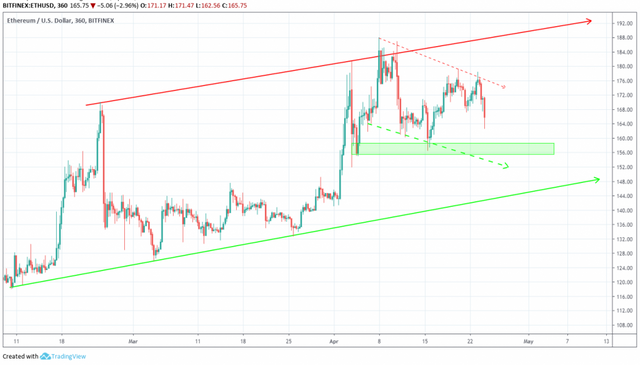
The closest support area is found near $156 and €140 and is found within the current trading pattern. Price is likely to decrease to this level and possibly reach the support line.
Summary of Analysis
Based on this analysis, the price of ETH is likely to decrease towards the support line of the channel. It is likely to reach the support area near $156 and €140 in the short-term. In such a case that prices fall below the support area and toward the support line, Ethereum may drop into the $150s and €130s.
To read 2019 and 2020 Ethereum price predictions, click on the green button below:
Do you think ETH will reach the support area? Let us know your thoughts in the comments below.
Disclaimer: This article is not trading advice and should not be construed as such. Always consult a trained financial professional before investing in cryptocurrencies, as the market is particularly volatile.
Posted from Bittabi Bittabi.com : https://bittabi.com/eth-usd-eur-price-analysis-april-24-can-ethereum-bounce-back/
Warning! This user is on my black list, likely as a known plagiarist, spammer or ID thief. Please be cautious with this post!
If you believe this is an error, please chat with us in the #cheetah-appeals channel in our discord.