Piecing together my work to create a bigger picture (first attempt)
Hi Everyone,
I have been on Steem since June 2017. Most of my posts relate to economics. Some of my posts are theoretical and some are applied. I have also included several contests as well as a six-week challenge series. In this post, I want to articulate how most of my posts and series fit together to create one big picture. This is a first attempt to create a logical fundamental link between most of my posts and videos. I will most likely revisit this area a few times to ensure that I correctly articulate the relationships between each area and topic.
I strongly believe it is essential that everyone should have at least some basic understanding of economics. Most people have some exposure to economics from school/college/university, the media, or personal experience.
The content taught in schools is generally not wrong but the emphasis is often misleading. The theory is often taught with very little application to the world. Academic syllabuses focus on mainstream determined theories. These theories may not necessarily be the most helpful or even the most realistic.
The media often presents a distorted view of economics and is generally very inaccurate. Gross Domestic Product (GDP), Consumer Price Index (CPI), and employment are presented as the most important macroeconomic indicators to the population. These indicators only portray part of the economic picture of the country.
People experience economics and apply economics on a daily basis. Most people are not fully aware of how they are applying economic concepts. So far, I have discussed several areas in our daily life where economics is applied or economics can be used to explain particular behaviour. Experiencing economics first hand is one of the best ways to understand how it works as well as how it applies to our own lives.
Putting the picture together
So far, I have not clearly articulated a strong connection between most of my posts. If you were to grab just a few random posts, the connections are not immediately obvious. If you get the impression that I am teaching economics for an economist audience, I would understand. Economics contains complex content that cannot be easily grasped by someone who is not familiar with economics and economic theory.
Economics is Everywhere
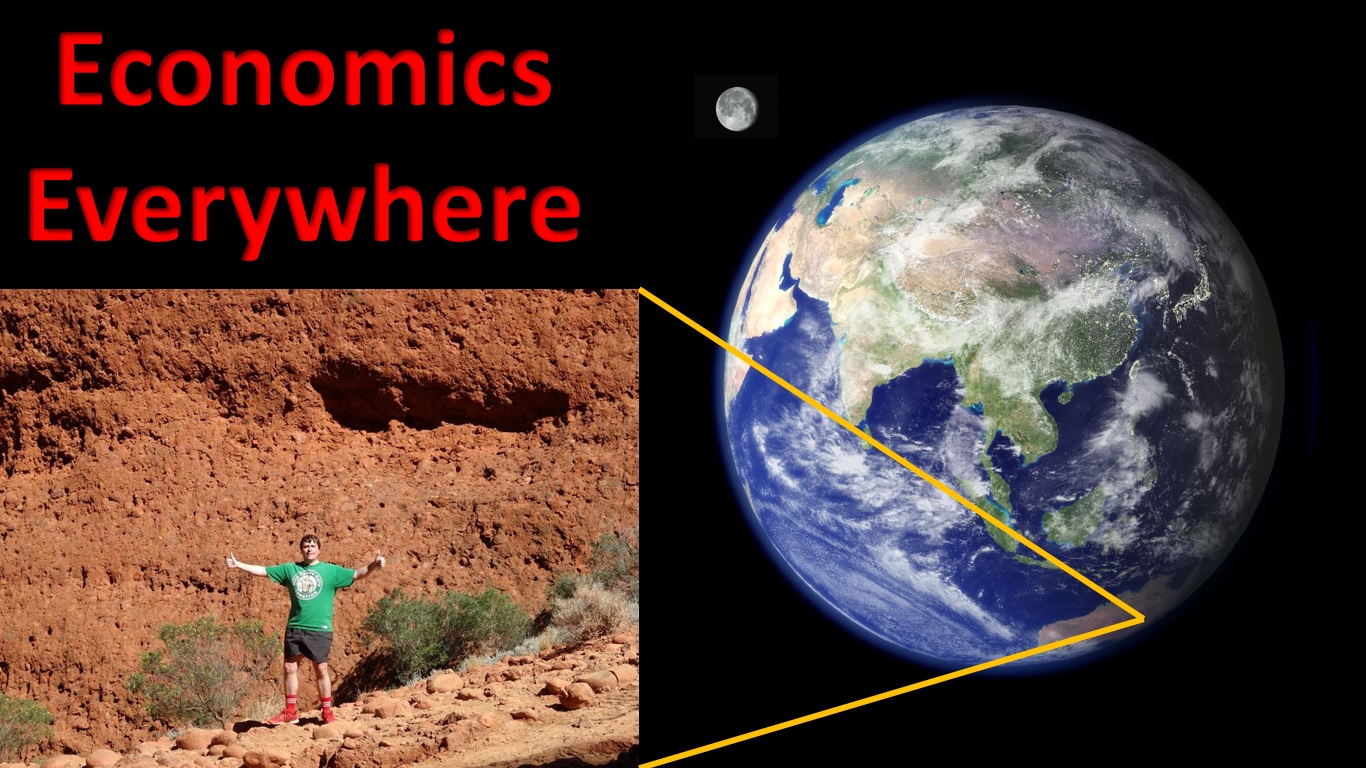
I believe the first step is to create awareness regarding the relevance of economics to our daily lives. My series ‘Economics is Everywhere’, explains how economics is or can be applied to everyday living. So far, I have covered areas such as a regular working day, going to the supermarket, going on a date, exercising, and going on holiday. Making simple decisions such as what to eat, how to get somewhere, and how long to stay somewhere involves basic economic principles that most of us apply subconsciously.
Understanding the extent of the application of economics feeds into almost all other areas of my work. Creating an understanding of why something is important increases the motivation to understand the areas that it supports.
Contests
I have attempted to create awareness of economics and analytical thinking through various contests. The puzzle contests focused on analytical thinking. The 6-week series focused on economic analysis and application. The buying and selling game contests focused on economic analysis and mathematics. The meme contests were for fun. Simply thinking and analysing problems can enable us to become analytical in our own lives. Steem is a greater enabler of contests as they can be funded through upvotes.
I am currently not running any contests. Once activity has increased on Steem, I will be running them again. I may have another 6-week challenge series at some point. I will bring back the buying and selling game. The buying and selling game requires a player to have basic knowledge of statistics, risk and economics to enable them to select the combination of goods and markets that maximises profit. The buying and selling game is explained in my post and video ’Buying and Selling Game Model’.
I believe if people actively participate in games and contests that require the application of economics, they will be better positioned to understand and/or relate to my other economics posts.
Steem Economics
Steem has its own economic ecosystem. It might be constructed very differently from traditional economic ecosystems but many economic principles can be applied to understanding how the Steem ecosystem functions. As one of the few economists currently creating content on Steem, I believe it is important to understand and explain how the economics of the Steem ecosystem functions. Economic concepts such as game theory, demand and supply, modelling and analysis, market structure, macroeconomics, and many others can be used to explain and describe the operation of Steem.
Social media has grown dramatically this millennium. Its popularity is overtaking traditional and mainstream media. Censorship as well as restrictions on monetising of content is hindering the growth of social media as an avenue of spreading information, education, and even entertainment. Steem has the potential to overcome these restrictions. The ecosystem still requires some tweaking to make that possible. Good analysis of the system is important for making recommendations regarding refinements.
Economic Modelling
I have written several posts relating to economic modelling. I have attempted to make several of them comprehensible to the layman. This can be difficult as much of economic modelling is technical. Economic modelling can be used to identify problems, trends, behaviour, and responses to changes in policy or stimulus. Economic modelling can also provide consistency to analysis that uses the modelling as an input. Economic modelling is versatile and can be applied to many areas.
Economic modelling can also be deeply flawed with incorrect or biased assumptions. Inaccurate modelling effects everything that uses the modelling as an input. Hence, all analysis and conclusions drawn from such analysis will be incorrect. Complex modelling such as general equilibrium modelling can provide detailed results but these are often inaccurate and misleading. Basic modelling does not provide as much detail but the outputs are more comprehensible and offer a general direction rather an answer.
Cost Benefit Analysis
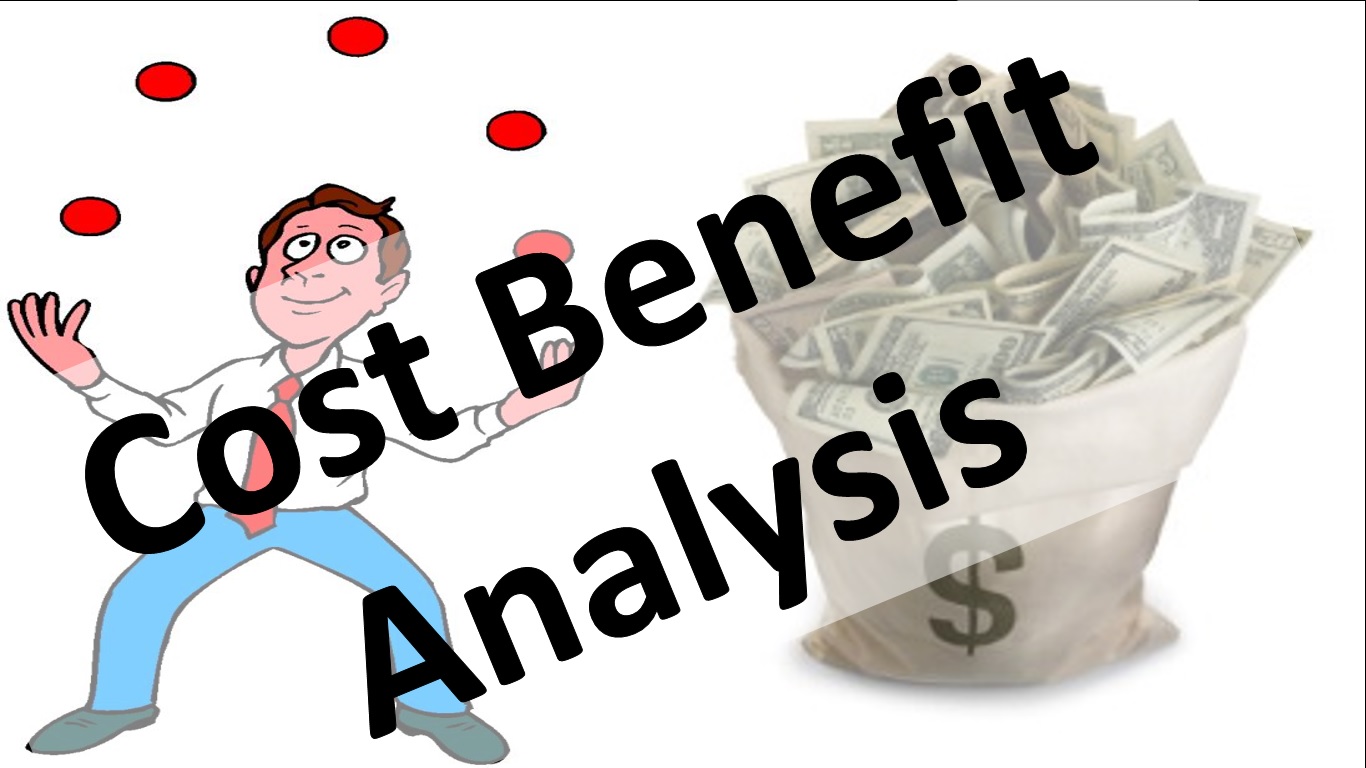
I have spent much of career conducting and reviewing cost benefit analysis (CBA). I have seen how, if done correctly, CBA can be a great input into decision-making. A CBA can provide decision-makers with information pertaining to social returns from an investment. A CBA can also do the exact opposite and result in very poor investment decisions. In my posts ’Cost Benefit Analysis (Part 1) - Dark Side of Economics #4’ and ’Cost Benefit Analysis (Part 2) - Dark Side of Economics #4’, I discuss, in some length, how CBA can be used to support any investment or policy decision that those in charge desire. The biggest danger regarding the misuse of CBA, is that it is passed off as being an accurate and definitive method of determining the viability of projects and policies.
Methods adopted from CBA include contingent valuation, revealed preference and willingness-to-pay. These methods feed into my work related to valuing time. Deception caused from CBA feeds into my ‘darkside of economics’ series.
Income Inequality
Income inequality is often given attention but very little is explained regarding its extent. Macroeconomic measures such as real GDP per capita are given emphasis as a measure of a country’s welfare. Real GDP per capita accounts for inflation and population but does not factor income distribution. Real median income also accounts for inflation and is not biased by the size of the population. Changes in real median income is a much better indicator of changes in income as it is not biased by large increases or decreases in income of people at the extreme ends of the income spectrum. Real median income indicates changes in the income of the middle class. Indicators of income distribution are rarely mentioned in the media. Such indicators include the Gini Index or the Generalised Entropy Index.
There are many reasons for income inequality. It can be a product of capitalism or a product of intervention. Income inequality is not always negative. Inequality of remuneration can be an indication of the value someone brings to society. Inequality of remuneration can also be an indication of discrimination or corruption. For income inequality to be considered positive, those receiving lower income must have the opportunities to close the income gap. Any action that inhibits these opportunities or encourages people to become dependent on the State are not desirable. Many Governments often choose to give handouts rather than provide opportunities.
Income inequality feeds into my other work in several areas. The negative aspects feed into my ‘darkside of economics’ series and the positive aspects feeds into my utility and valuing time posts.
Macroeconomics
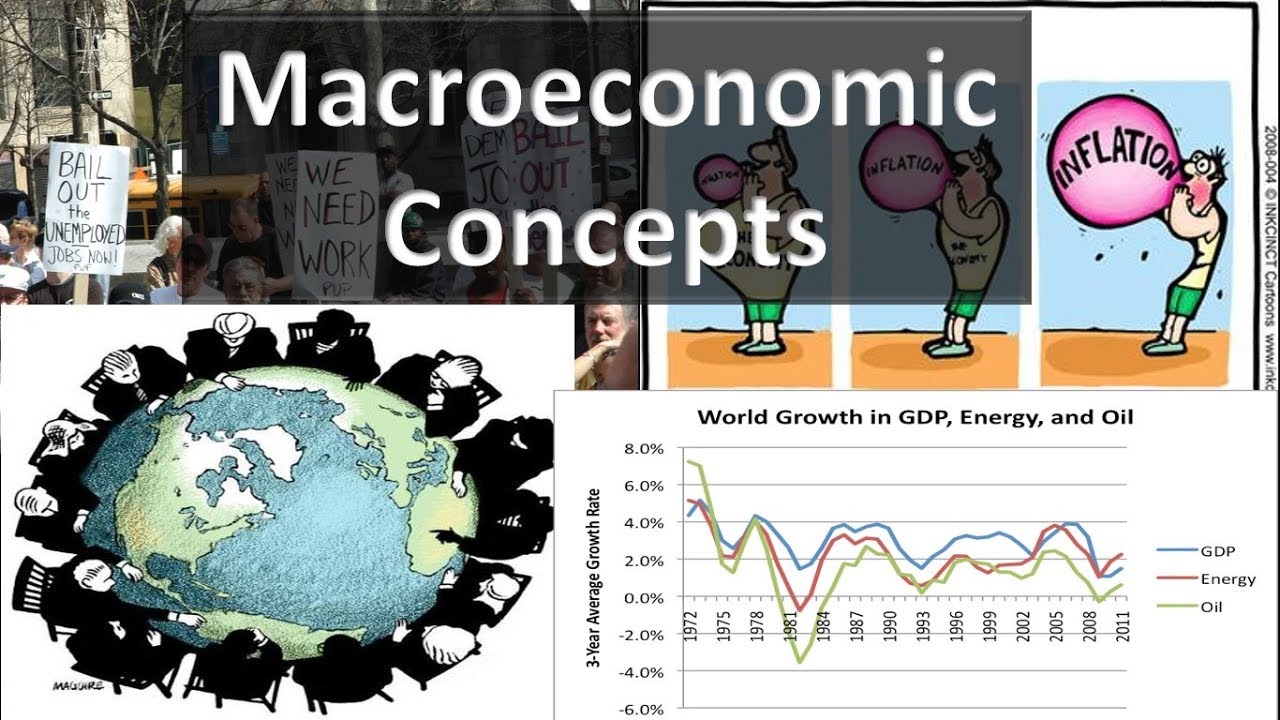
Macroeconomics is a very important area to understand. Macroeconomics is very frequently discussed in the media. Topics such as economic growth (GDP), inflation (CPI or PPI), unemployment, interest rates (cash rate), trade deficit, budget deficit, and national debt are typically discussed. Most people I have met have some idea what these indicators measure and the implications of changes in the values of these indicators. Few people understand that these indicators only tell part of the story. Few also do not understand that the numbers are not always an accurate representation of reality. For example, reducing the trade deficit (i.e. exports – imports) does not necessarily translate into reducing budget deficit and national debt. Reducing national debt does not reduce private or household debt.
Macroeconomics feeds into my ‘darkside of economics’ series because macroeconomic indicators are often used as a scare tactic to force public compliance to certain Government initiatives or changes in legislation. For example, in the United Kingdom, projected macroeconomic indicators for a no deal Brexit are being used as a scare tactic to gain public support for the very unfavourable Brexit deal.
Game Theory
Game theory is fundamental to most of my content. Game theory can be used to greatly improve our lives. It can greatly encourage cooperation to achieve better outcomes for all. The application of game theory can improve and help us understand how the Steem ecosystem operates; I have referenced game theory in several of my ‘Steem economics’ posts.
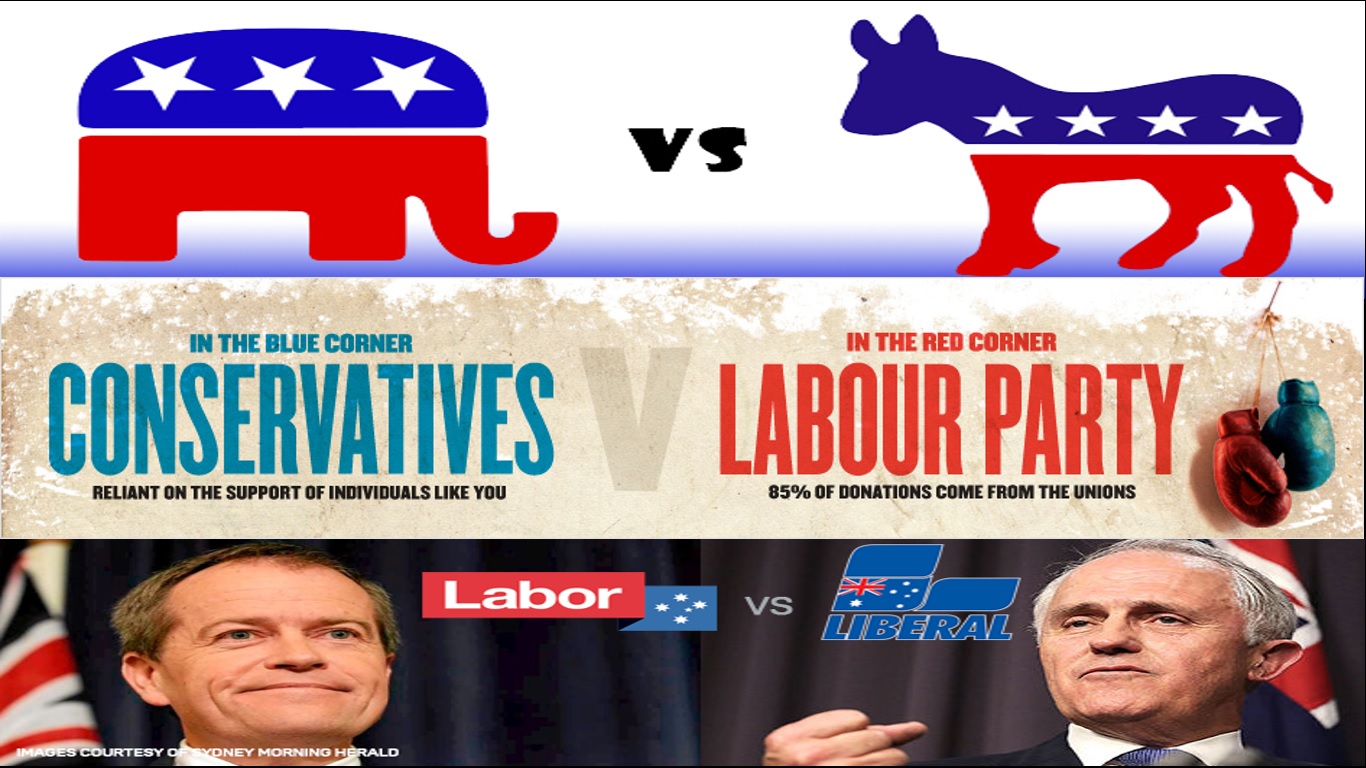
Game theory can also be used to manipulate people. In my posts, I have described the divide and conquer strategies and the controlled opposite strategies. Both these strategies are used to prevent people from banding together. The controlled opposition strategy is used to control the results of contests. This could be done by the companies, which owns ‘competing’ brands or by powerful companies, secret societies or individuals that control both sides of politics. My work on controlled opposition feeds into my ‘Darkside of Economics’ series.
Valuing of time
Valuing quality of time is an area I having been pushing in opposition to valuing money and monetary wealth. Society are pressured through various sources to pursue monetary wealth and material possessions. This pressure comes from schools, parents, media, and Government. I have worked on explaining and demonstrating that quality of time should be of greater importance than accumulating monetary wealth. Money can be used to improve quality of life but acquiring money usually comes at a sacrifice. This sacrifice for many is the 9 to 5 (not including travel time, for me it was more like a 7 to 7 job), 5 day a week job. If those 12 hours a day are spent doing something you love, the sacrifice is smaller. If you are counting the minutes to the weekend, then maybe you are not making great use of your time.
Aiming to maximising the use of your time will lead to a better quality of life. This feeds into my work relating to utility (satisfaction or enjoyment expressed in economic terms). My ‘darkside of economics’ series looks at how the system pushes people to work more hours just to meet daily needs. Technology has advanced considerably, we should be working far less hours than we did 50 years ago. Instead, many households need at least two full-time working adults to survive.
Cruelty-free economics
Most of my cruelty-free economics posts focus on veganism and vegan values. Reducing cruelty to animals is something within all of our reach. Therefore, in my opinion, actively reducing cruelty to animals through our actions is a great place to start to make the world a better place. There is plenty of cruelty committed in the world, which we cannot directly influence. Therefore, the most logical place for us to start are with the areas we can directly influence. Eventually, we can work our way to the areas we can only indirectly influence.
My work relating to value of time is also applicable to animals as well. For example, the quality of time spent in a cage can be compared to the quality of time of living free. Animals cannot speak for themselves using words but their behaviour can speak volumes. Cruelty-free economics goes beyond direct cruelty to animals but also applies to the costs that rearing animals has on humans as well. For People bear costs in terms of providing subsidies to farmers, the environmental damage, and future food shortages because of the consumption of land and water required for producing food to feed the many animals that people consume.
Market Structure
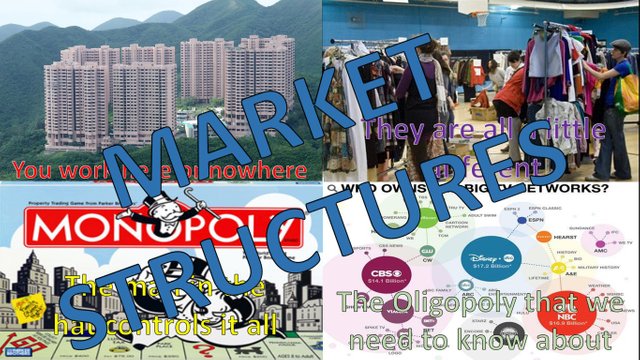
Market structure is essential to how demand and supply functions. Some market structures such as monopolies and oligopolies give greater control over price to producers. Some market structures such as oligopsonies and monopsonies give greater control to the buyer. I identified Steem as an oligopsony market structure for content creators. The oligopsony market structure can be expected to change as the concentration of wealth decreases and as large stakeholders delegate to more users.
Market structures tend to favour the big and the few. Monopolies tend to be Governments selling essential services. Monopsonies tend to be large multinational corporations or Government agencies offering employment. These structures contribute to income inequality and poverty. My work on market structure supports my ‘darkside of economics’ series.
Market structures can also support growth and opportunity. The monopolistic competition market structure encourages cooperation amongst smaller firms. Monopolistically competitive firms generally offer a variety of goods and services at competitive prices. The cost structures of the firms will determine the number of firms. Higher costs will likely reduce the number of firms and lower costs will likely increase the number of firms. High costs can be reduced through cooperation amongst firms to achieve economies of scale (reduced costs from increased size of operations). Market structure also feeds into increasing utility and welfare.
Darkside of Economics
My ‘darkside of economics’ series contains some of my most important work. It is also one of my most controversial series. The series looks into the manipulation of the people by Governments and large corporations.
In this series, I have investigated how democracy is used as a tactic to create the illusion of freedom (i.e. application of game theory). I have investigated the use of taxation to transfer power to the Government. I have explained how Governments are using taxes to support their own agendas as well as transfer wealth to large corporations. Several of my game theory posts further support the manipulation of taxpayer money.
As part of the darkside series, I have my series relating to scarcity. This series explains what is meant by scarcity and if it really exists. In this series, I also define what I call ‘contrived scarcity’. This type of scarcity exists simple because someone wants scarcity to exist. Scarcity is used to create shortages and desperation. Therefore, prices and profits increase. Scarcity is defined in many economics textbooks and courses as a fundamental problem, which economics is intended to solve. Ironically, scarcity is a problem caused by the manipulation of economics in order to benefit the few.
My darkside series has also explored health, education, debt, mortgages, war and several other areas. I still have a lot to cover in my darkside series. I will be delving into much more detail in 2019. This will be easier now, as I can support most of my work in this series with references to theory explained in my other content.
Utility
Utility is a crucial aspect of economics. Utility is a measure of enjoyment or satisfaction obtained from something. This could be a good, a service or some form of experience. Utility has been typically aligned with acquiring material wealth. For example, how much utility does someone obtain from buying a chair? My major criticism of the way utility is treated is that that utility is measured based on the acquisition of something rather than the time that is spent enjoying that something. My work on value of time (i.e. quality of time) feeds into utility theory. I have developed an algorithm that can be used to help model ‘value of time’ in utility.
My approach to utility is to help people understand that sacrificing time for material possessions is often not the most fulfilling way to experiencing life.
Utility is also a fundamental determinant of demand. Understanding what feeds into determining utility will help us to understand what drives demand for goods, services or anything else. Demand is met with a supply of something that will address or at least partially address the demand. If people do not fully understand how to maximise their own utility, demand will not be a true reflection of their needs and wants. If demand is not a true reflection of their needs and wants, supply will only address the apparent needs and wants reflected by demand. In other words, the wrong goods and services might be provided. The wrong quantity of goods and services might be provided. The supply response to demand can also shape the type of market structure that is formed.
Quick summary of relationships between areas and topics
Above is a very rough diagram demonstrating the relationships between many of my topics from my posts/series. At this stage, the diagram is just an indication of the linkages. I will make a more elaborate set of diagrams to define, more accurately, the linkages between areas, topics and sub-topics.
The diagram consists of the areas and topics that I have discussed in this post as well as arrows indicating the direction of the relationships between them. The arrows are colour coded to identify linkages when lines overlap. For example, ‘economic modelling’ feeds into ‘macroeconomics’, ‘income inequality’, ‘cost benefit analysis’, and ‘Steem economics’. Some arrows go in both directions; this indicates areas and topics, which feed into each other. For example, ‘market structure’ influences ‘utility’ in the form of consumer surplus and ‘utility’ influences demand and the response of supply to that demand, which therefore influences the type of market structure.
Some of the arrows represent causation or contribution such as ‘valuing time (quality)’ contributes to ‘utility’. While other arrows represent an explanation for a particular area such as ‘game theory’, which explains particular elements of ‘Steem economics’.
Conclusion
This post is a broad first attempt to link most of my work together to demonstrate logical relationships. It is quite a challenge to articulate all of the relationships between various areas and topics. In future posts, I will elaborate on these relationships and the importance of them to the bigger picture. I want to make my work as comprehensible as possible to a wider audience without compromising on the level of detail of my content.
Thank you for taking the time to read this post.
More posts
To access the entire content, which I have discussed in this post, you can click on the links below. These links will lead you to posts containing my collection of works. These posts will be updated frequently.












Thanks so much for the overview of your work! As I discovered your writings rather late, I'll make sure to go back and read everything from the start. Wish I could upvote some or all of your older posts as well because most of them is evergreen content.
Posted using Partiko Android
Thanks for your support @organduo.
Most of my content still has context today. I can always revisit and provide updates to some of my work or even provide further discussion.
Loving the links between all the concepts!
Thanks @magicmonk. Linking concepts can be quite tricky. I think I still have a bit more work to do.
Hi, @spectrumecons!
You just got a 2.82% upvote from SteemPlus!
To get higher upvotes, earn more SteemPlus Points (SPP). On your Steemit wallet, check your SPP balance and click on "How to earn SPP?" to find out all the ways to earn.
If you're not using SteemPlus yet, please check our last posts in here to see the many ways in which SteemPlus can improve your Steem experience on Steemit and Busy.
Congratulations! Your post has been selected as a daily Steemit truffle! It is listed on rank 6 of all contributions awarded today. You can find the TOP DAILY TRUFFLE PICKS HERE.
I upvoted your contribution because to my mind your post is at least 6 SBD worth and should receive 185 votes. It's now up to the lovely Steemit community to make this come true.
I am
TrufflePig, an Artificial Intelligence Bot that helps minnows and content curators using Machine Learning. If you are curious how I select content, you can find an explanation here!Have a nice day and sincerely yours,

TrufflePigGreat to see my favourite bot. I am not too far off the target of 6 SBD.
Hi @spectrumecons!
Your post was upvoted by @steem-ua, new Steem dApp, using UserAuthority for algorithmic post curation!
Your UA account score is currently 4.629 which ranks you at #1657 across all Steem accounts.
Your rank has improved 7 places in the last three days (old rank 1664).
In our last Algorithmic Curation Round, consisting of 198 contributions, your post is ranked at #47.
Evaluation of your UA score:
Feel free to join our @steem-ua Discord server
It looks like a big job, but I know you can do it. Just take it one step at a time. I'm excited to see what you can come up with!
Thanks. This whole exercise is also helping me become more organised for future posts as well.