What Is The Yield Curve And What Does It Mean?
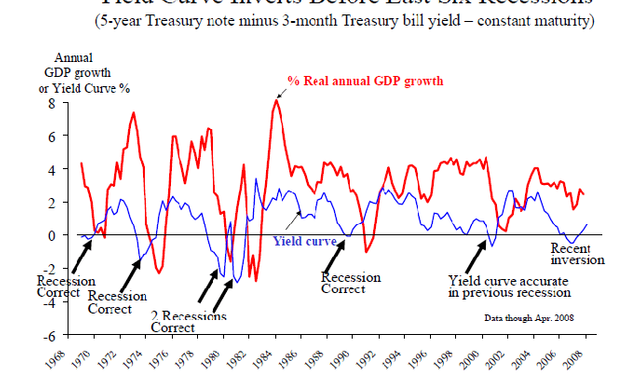
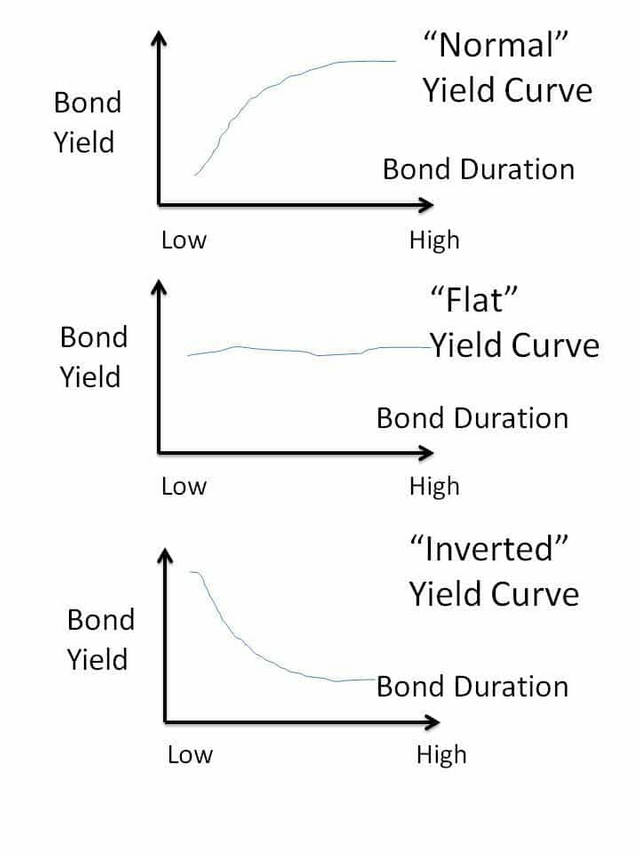
The yield curve has been a predictor of recessions for as long as they’ve existed. It’s an important tool for the finance industry as a whole because it determines what rates banks can lend at. So, you ask, what exactly is the yield curve? It’s essentially a line that plots interest rates on bonds from various timeframes, but usually 2 to 30 years. The rates help other Industries determine a benchmark for mortgages or bank lending rates. There are three types of yield curves: normal, inverted, and flat.
A normal yield curve indicates that yields on longer-term bonds may continue to rise in periods of expansion. In a healthy economy, longer-dated bonds will have a higher yield than shorter-term bonds because of the risk associated with time. In a rising interest-rate environment, investors place their money into shorter-term bonds because the value of longer-term bonds will be less until rates plateau. This dynamic places extra pressure on shorter-dated bonds, which steepens the curve. An inverted yield curve indicates that short-term bond yields are higher than long-term bond yields, which inverts the curve. When investors believe that longer-term rates will be coming down, they jump into rates that are locked in before they fall farther. Demand for long-term bonds will increase the price, but drive down the yield. The extra demand for long-term bonds decreases demand for short-term bonds, which lowers the price and raises the yield. A normal or flat yield curve occurs when the economy begins to go from expanding to slower growth. Yields on the 2-year and 5-year bond will rise, and the 10- to 30-year bond will fall, similar to where we are now.
With a little background on the flattening yield curve, this brings us to the state of the economy today. Central banks are continuously buying bonds, even when it’s like they’re catching a falling knife. If you look at the candlesticks on a trading platform, you can definitely see that the banks are buying bonds every morning and moving into small-cap stocks to keep the market stable. If small-caps do not stabilize, the banks move over to tech stocks. This trend has happened for some time, and the flattening of the yield curve has trended alongside. It looks as if the market is starting to see through the Fed’s doublespeak. The 10-year bond in December 2016 was 2.387, and it is 2.485 today. the 30-year bond in 2016 was 3.065, and it is 2.833 today. If you analyze the steepness of the 5- to 30-year curve, the difference is 58 basis points. This is a 10-year low, and it’s indicating that a recession is near. A recession in the next 12 to 18 months seems likely.
A dovish Fed began speaking in December about raising rates and the contraction it will cause on the economy. Anyone who pays attention to the economy and the state of it knows that the Fed is stuck. One theory is that central banks are trying to stabilize the system and keep it alive while blockchain tech is being built parallel. I hope this is what happens and the imbalances throughout our world gradually even out. The state of the economy, the environment, and the general well-being of people are in serious jeopardy.
Follow me @colinb or read at https://crushthestreet.com/articles/breaking-news/yield-curve-mean.
Cheers,
Colin


Hi! I am a robot. I just upvoted you! I found similar content that readers might be interested in:
https://crushthestreet.com/articles/breaking-news/yield-curve-mean