Cryptocurrency Market Analysis
Volume 1 – Bitcoin and Cryptocurrency Adoption
Introduction
Bitcoin has been around since 2009 and began with a value of less than 1 cent and is now valued at over $3,900 USD and $4,999 AUD.
This article seeks to review the progress of Bitcoin adoption to date, and theorise how this trend may behave in the future.
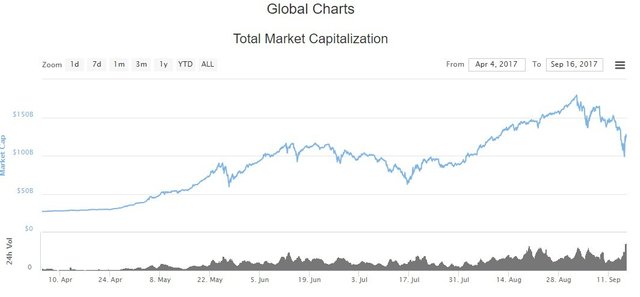
To begin with, let’s take a look at the two charts below. Both are total market capitalization of the whole Cryptocurrency market. The oldest one only covers Bitcoin as there were no other crypto currencies back then, now there are more coins and tokens than just Bitcoin, however I want to focus on the whole crypto space to begin with.
Market Capitalisation Charts
The first chart shows April 2017 to Sep 2017 (covering the most recent price appreciation), and the second one covering the first big spike in popularity and price.
Market Action April 2017 to Sep 2017
Market Action October 2013 to Jan 2014
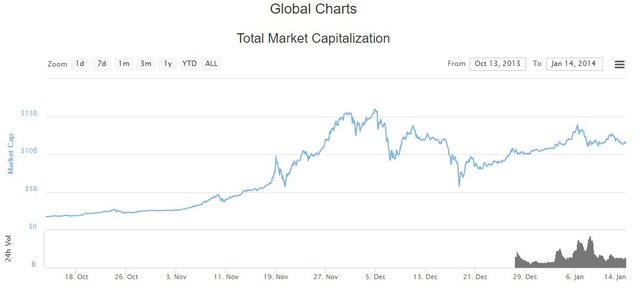
Take particular note of the volume spike (grey chart underneath the blue line). You’ll note that prior to Dec 27th 2013 there was not even a volume measure in the crypto space. That’s how young this market is. It’s only been possible to track volume since December 2013!!!
Prior to Dec 2013 hardly anyone had heard of Bitcoin. While statistically speaking this is still the case, the tiny number of people using and investing in BTC back then meant there was no real liquidity in the market.
Public Attention in 2013
In 2013 there was a lot of BTC talk in all kinds of circles. Here’s a small sample;
- China’s Central Bank banned bitcoin transactions (yes, this “China FUD” has happened before)
- Bit Instant CEO charged with Money Laundering (on a technicality, no criminal intent)
- FBI shut down Silk Road then the two lead agents stole millions of $ worth of BTC and were later convicted of the crime
- Homeland Security Seized funds form a Mt Gox (bitcoin exchange) account
- And of course, Bitcoin was declared dead 15 times…
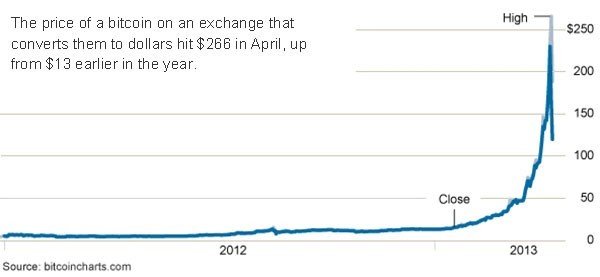
As you can see, much of the news was not positive for Bitcoin and yet we saw the price grow exponentially over the same period. We also saw a massive correction from over $250 USD back down near $120 USD. So that was it for Bitcoin I guess…
Well fast forward to today (27th Sep 2017) where we have seen BTC price increase to almost $4,000 USD (down from a recent high of almost $5,000 USD and back up from a recent low of just over $3,500 USD).
One thing we can say for certain is that this market is a volatile one.
So where does market volatility come from?
- Maturity (age) of the market - Crypto in general is a very, very new market and as such is likely to be a lot more volatile than something like a stock, FOREX or commodities market.
- Liquidity – A market needs a lot of liquidity to buffer against large price fluctuations in either direction.
- Diversity – A diverse market is a stable one (generally speaking). The more players you have the less likely it is that any one (or group) can directly impact the market as a whole.
Unpacking the Market
To better understand the market as a whole, let’s take a minute, step back and look at some key points for the Bitcoin market from inception to the 2013 peak and crash. By doing this we may gain perspective into upcoming market conditions. Hindsight is always 20/20 it’s true, but historical analysis is the only good method to predict future outcomes in my experience.
Percentage Ownership / Stake in BTC
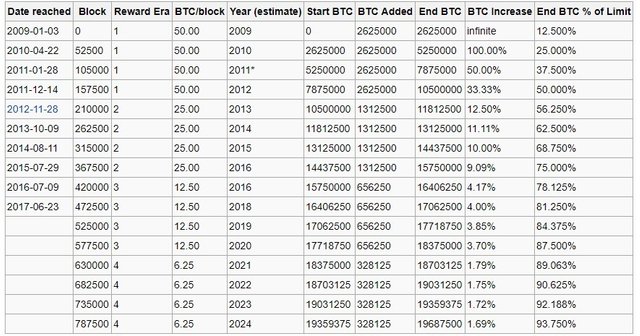
Back in 2013 there were roughly 12 Million Bitcoin in existence and a small selection of people owned the majority of them.
Number of Bitcoins in Existence
The chart below shows it loud and clear. I was one of the 1 million individuals who had bugger all BTC in 2013 but there were some who had a lot!
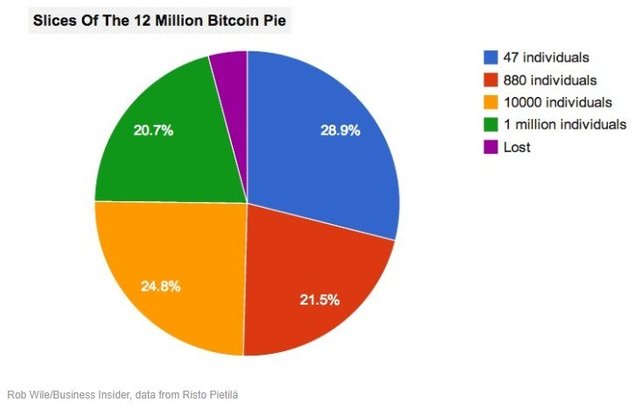
47 people had 29% of all Bitcoin in 2013 and the top 927 people owned HALF of the entire BTC market… Most of the people in that group of 927 people were very early adopters who mined them on their home PC’s.
They were not rich people, they were just early adopters and BTC enthusiasts. Most were not even astute investors, they were literally just playing around with them and BAM! Suddenly they were wealthier than they’d ever dreamed (at the time).
Lambo’s
Venture into any Crypto forum or Facebook page and you’ll see tons of people talking and joking about what colour “Lambo” they’re going to buy when they’re a crypto millionaire.
Well that all started here.
So what happens when 927 people own ½ of the equity in a market, they aren’t “old money” wealthy, and they want their fricken Lambo’s? It’s called a mass sell off.
Lesson in Liquidity
It takes a lot of “New Money” to come in and purchase assets from “Old Money” to turn theoretical value into actual value and 2013 was the first time we saw this with Bitcoin on any real scale.
Early adopters wanted some rewards for their efforts and patients. Dumping even small parts of their holdings would have crashed the market overnight and they knew such events weren’t in their best interests individually or collectively. It had to be a slow but sustained sell off in order for them to get some actual value from selling in such an ill-liquid market.
We then saw a lot of trading volume come into the market. Volume TRIPPLED in less than two months!
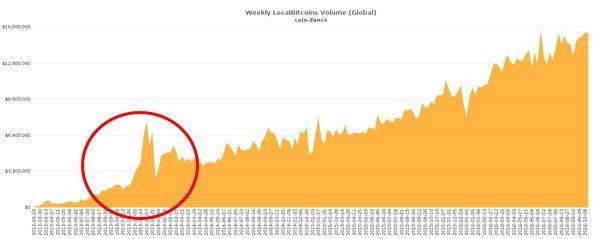
On average, the increase in traded volume of BTC looks nice and linear, but there was a massive spike in 2013. This is very much in line with the price spike (and fall) of the same period.
I believe this is the period where the large holders of Bitcoin (otherwise known as “Whales”), learned a thing or two about liquidity.
If you listen to any interviews with any of the high profile large BTC holders, they’ll joke that they own enough BTC that they still need to be careful of how much they sell at a time due to the impact they have on the market when they do.
They don’t “think” this will happen, they remember it from last time…
What Does All This Mean?
In short, no one can tell you with any absolute certainty they know what’s going to happen and when. That’s true in any market, but the crypto market has made a habit out of making experienced market analysts look like rank armatures.
I’m not about to make the same mistake as many before me by making absolute predictions on price or direction over the short to medium term but I think the charts I’ve shared here say a lot for themselves.
Here’s a few final points to distil my thoughts on the market so far:
• Attention (good or bad) tends to bring more people into the crypto space. More people = more volume and more volume (especially from new money) = increased price
• Over enthusiastic, newly wealthy holders tend to cause sell off’s after large spikes in price and volume. These “crashes” have been recovered from and new all-time highs have been achieved after each previous recovery to date
• There are almost no “real businesses” functioning on the block chain right now. What I mean by that is the only actual use cases thus far are either trading tokens, storing tokens, distributing tokens or hosting tokens, or they are currencies
• The next 12 months will likely see a flurry of new crypto businesses with actual (non crypto currency) use cases take off. Many of them have launched their ICO already and are in the final stages of build out of their projects
• Once these real businesses start to disrupt competitors on the “old” system of centralised, compartmentalised control, I believe we’ll see the largest and fastest increase in cryptocurrency adoption to date!
If you like this kind of content, follow me on Steem It and ask to join our Facebook Group Bit School


Very interesting article thanks !
Bitcoin is the Cryptocurrency Phenomenon. Nice!
Cheers!
Congratulations @simoncase! You have completed some achievement on Steemit and have been rewarded with new badge(s) :
Click on any badge to view your own Board of Honor on SteemitBoard.
For more information about SteemitBoard, click here
If you no longer want to receive notifications, reply to this comment with the word
STOPgreat job @simoncase

Thank you very much for sharing inspiring content.
my pleasure :-)