Sentiment analysis: Top and bottom coins for week of June 11
Wow, so uh...let me just try to wipe the blood off the screen before I start this.
It goes without saying that the market's been through a rough ride, and that is the big disclaimer to start this post. If $BTC doesn't get it's act together, there's not much hope for the rest of the market.
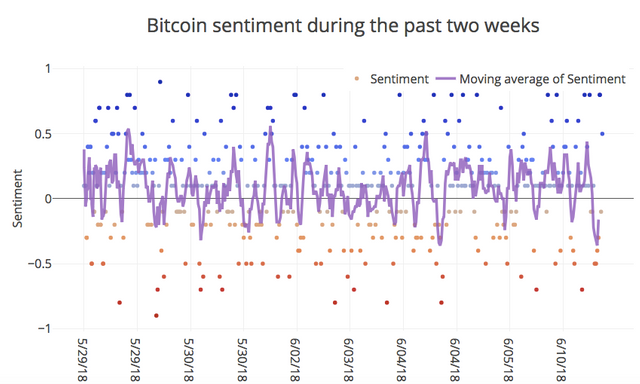
If you look at the chart above, it's concerning to me for a few reasons. First, we've been making lower lows in sentiment for the past two weeks. And when we finally leveled off for a bit (as of this writing), I'm not seeing the kind of bounce you'd expect with a short-term bottom.
Most of the 100 influencers and traders I follow for this analysis remain nervous and tentative, so until there's a clear bottom in trading across the market is risky. So if you're going to play 'catch the knife', good luck to you.
New features!
You'll notice a few new elements, where available.
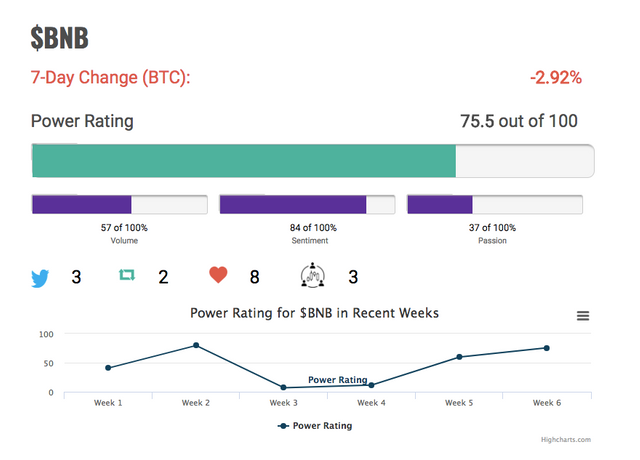
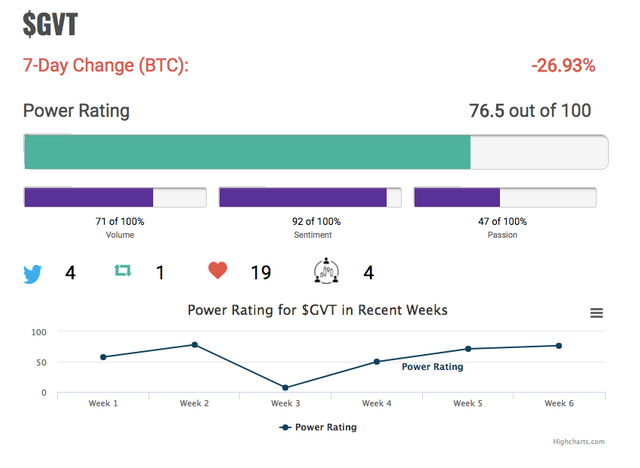
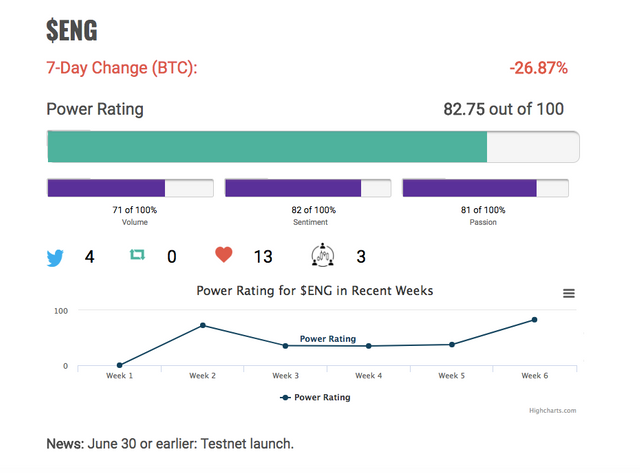
- I'm adding the 7-day price change in $BTC for each coin here for some perspective.
- I'll now be giving a few of the bottom coins by power rating. I figure it's worth taking a look to see if any of these coins/tokens are nearing a bottom.
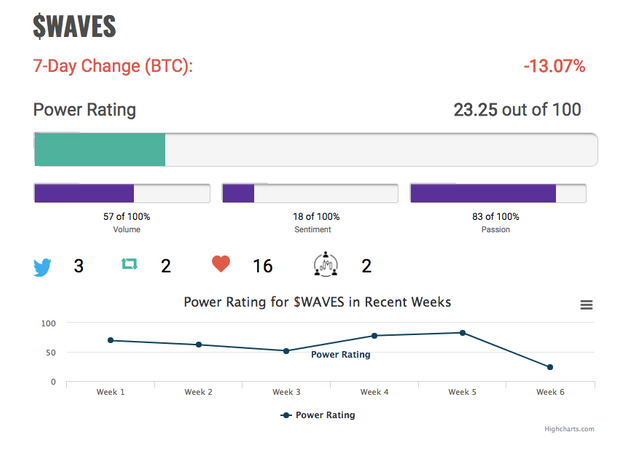
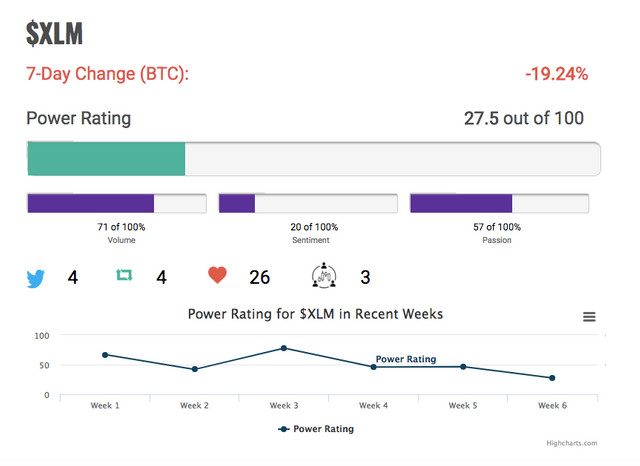
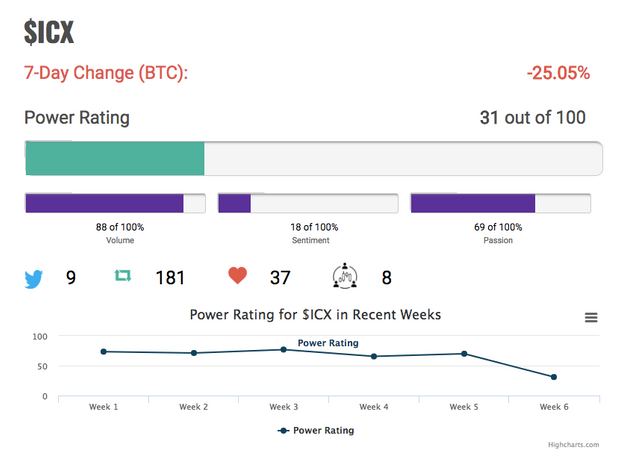
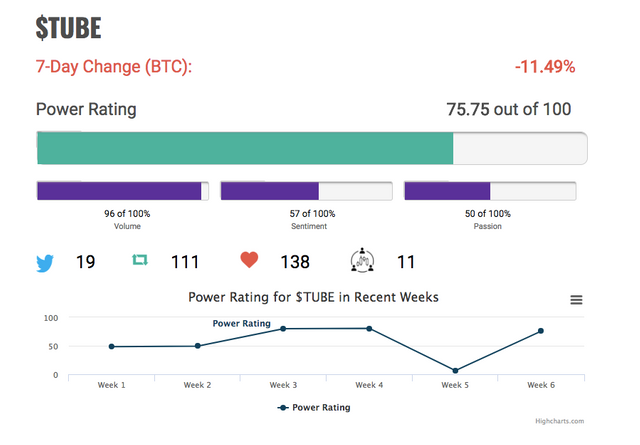
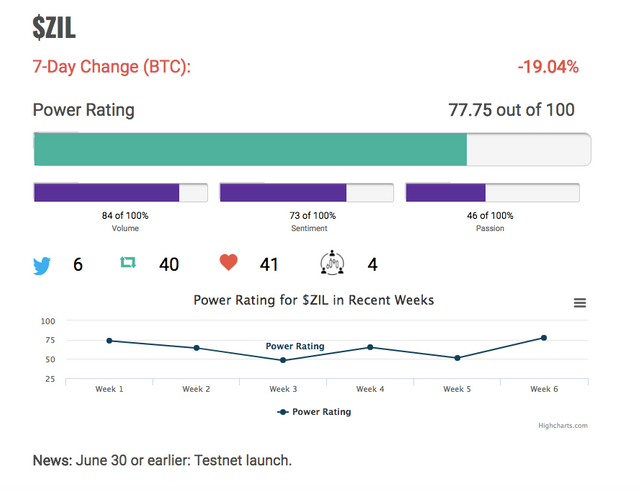
- Lastly, where I have data, you'll now see a line chart showing the power rating for each coin featured over the last several weeks.
I'm continuing to workshop things, add things and change them as I go along. I'm working hard on getting a website together so you'll all be able to review all these graphics and data for every coin I track.
The Top Alts
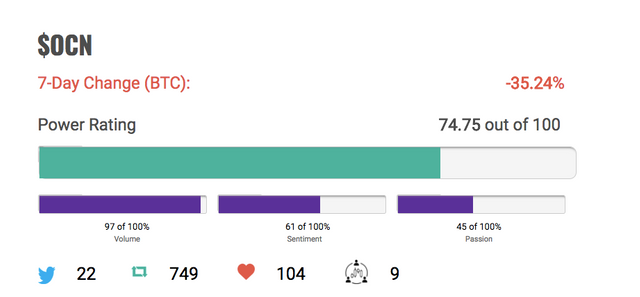
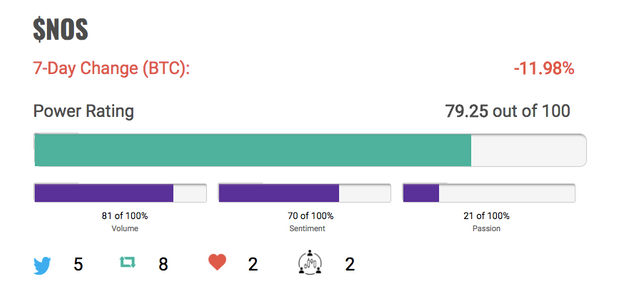
These coins had the highest overall power rating for last week, which is compiled using a weighted formula combining sentiment, volume of mentions and total number of unique influencers who mentioned it.
7.
6.
5.
4.
3.
2.
1.
The Bottom Dwellers
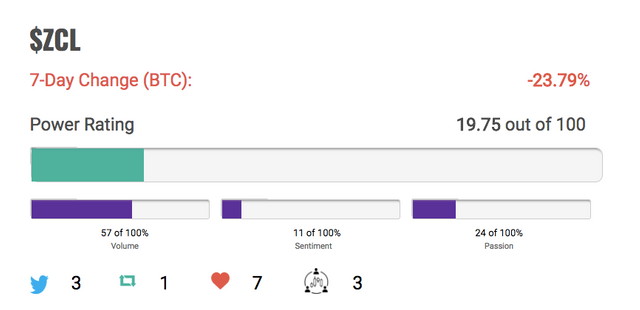
These are the most notable coins on the bottom of the pile. Coins/tokens with less than 4 mentions and 3 influencers were excluded.
The data
| Coin | Mentions | Influencers | Sentiment (of 100) | Power Rating |
|---|---|---|---|---|
| ADA | 8 | 4 | 37 | 60.5 |
| AE | 2 | 2 | 31 | 37 |
| AION | 2 | 2 | 76 | 59.5 |
| ALQO | 2 | 1 | 95 | 56 |
| APR | 1 | 1 | 100 | 50 |
| ARDR | 1 | 1 | 0 | 0 |
| ARK | 1 | 1 | 7 | 3.5 |
| ARO | 3 | 2 | 14 | 34.25 |
| AUC | 2 | 1 | 8 | 12.5 |
| BAT | 1 | 1 | 24 | 12 |
| BBO | 3 | 2 | 15 | 34.25 |
| BCH | 15 | 7 | 54 | 73.5 |
| BIS | 2 | 2 | 38 | 40 |
| BITG | 1 | 1 | 5 | 2.5 |
| BIX | 4 | 1 | 87 | 61 |
| BLZ | 2 | 1 | 24 | 20.5 |
| BNB | 3 | 3 | 84 | 75.5 |
| BTC | 289 | 55 | 58 | 79.25 |
| BTCP | 1 | 1 | 38 | 18.5 |
| BTCZ | 1 | 1 | 7 | 3.5 |
| BTS | 1 | 1 | 76 | 38 |
| CV | 1 | 1 | 15 | 7 |
| DASH | 1 | 1 | 61 | 44 |
| DAXT | 3 | 2 | 53 | 40.25 |
| DBET | 1 | 1 | 76 | 38 |
| DCR | 2 | 1 | 9 | 26 |
| DGB | 2 | 2 | 31 | 24 |
| DGD | 1 | 1 | 0 | 0 |
| DIG | 2 | 1 | 84 | 51 |
| DIVX | 1 | 1 | 99 | 69.75 |
| DOGE | 4 | 4 | 38 | 49 |
| DRGN | 2 | 2 | 11 | 14 |
| DRV | 1 | 1 | 9 | 17.5 |
| ENG | 4 | 3 | 82 | 82.75 |
| EOS | 32 | 12 | 57 | 53 |
| EQL | 1 | 1 | 76 | 51 |
| ETC | 2 | 2 | 95 | 80.75 |
| ETH | 23 | 15 | 52 | 62.75 |
| FOR | 5 | 2 | 19 | 29.75 |
| FOTA | 1 | 1 | 38 | 18.5 |
| FUN | 1 | 1 | 15 | 27.25 |
| GAME | 1 | 1 | 38 | 31.5 |
| GVT | 4 | 4 | 92 | 76.5 |
| HKN | 2 | 2 | 76 | 46.5 |
| HPB | 4 | 2 | 61 | 72.25 |
| HXX | 1 | 1 | 38 | 31.5 |
| ICX | 9 | 8 | 18 | 31 |
| IFT | 2 | 2 | 11 | 36 |
| INS | 1 | 1 | 38 | 40.5 |
| IOTA | 17 | 5 | 29 | 37.75 |
| IPBC | 6 | 5 | 71 | 56.5 |
| KEC | 2 | 1 | 92 | 67.5 |
| KLKS | 5 | 2 | 91 | 65.75 |
| KMD | 3 | 2 | 92 | 60.25 |
| LBC | 1 | 1 | 5 | 2.5 |
| LINDA | 3 | 1 | 94 | 85 |
| LOOM | 2 | 2 | 31 | 24 |
| LTC | 20 | 9 | 51 | 49.5 |
| MUE | 4 | 1 | 23 | 50.5 |
| MWAT | 2 | 1 | 76 | 46.5 |
| NANO | 10 | 6 | 28 | 49 |
| NCASH | 3 | 3 | 30 | 28.75 |
| NEO | 2 | 2 | 38 | 27 |
| NEXO | 1 | 1 | 38 | 31.5 |
| NLX | 1 | 1 | 61 | 31 |
| NOS | 5 | 2 | 70 | 79.25 |
| NULS | 1 | 1 | 2 | 14 |
| OCN | 22 | 9 | 61 | 74.75 |
| OMG | 2 | 2 | 31 | 24 |
| ONT | 7 | 4 | 34 | 57.5 |
| OST | 1 | 1 | 38 | 37.75 |
| PCN | 3 | 3 | 96 | 62.25 |
| PHR | 7 | 3 | 60 | 71.5 |
| PIRL | 2 | 1 | 4 | 23.5 |
| POE | 4 | 4 | 61 | 48.5 |
| PROC | 4 | 2 | 82 | 58.5 |
| QSP | 1 | 1 | 38 | 38.75 |
| REL | 2 | 1 | 97 | 57 |
| RLC | 4 | 4 | 35 | 35 |
| RTY_F | 1 | 1 | 38 | 18.5 |
| RVT | 2 | 1 | 24 | 33.5 |
| SAFEX | 1 | 1 | 76 | 38 |
| SALT | 3 | 2 | 22 | 44.5 |
| SCT | 1 | 1 | 87 | 43.5 |
| SENT | 3 | 3 | 38 | 32.75 |
| SKY | 3 | 3 | 86 | 70.25 |
| SNAP | 1 | 1 | 2 | 14 |
| SPX | 1 | 1 | 61 | 44 |
| SS | 2 | 2 | 55 | 36 |
| STORM | 3 | 2 | 61 | 45.25 |
| STRAT | 3 | 2 | 71 | 62.75 |
| TAU | 1 | 1 | 38 | 18.5 |
| TEL | 1 | 1 | 87 | 43.5 |
| TFD | 4 | 2 | 73 | 54 |
| THETA | 2 | 1 | 20 | 40.5 |
| TKY | 1 | 1 | 87 | 43.5 |
| TOMO | 1 | 1 | 61 | 55.5 |
| TRAC | 1 | 1 | 2 | 20.25 |
| TRX | 10 | 6 | 59 | 51.5 |
| TSC | 1 | 1 | 38 | 31.5 |
| TUBE | 19 | 11 | 57 | 75.75 |
| VEN | 5 | 4 | 30 | 48.25 |
| VRC | 1 | 1 | 24 | 12 |
| WABI | 2 | 2 | 84 | 51 |
| WAN | 10 | 8 | 36 | 40 |
| WAVES | 3 | 2 | 18 | 23.25 |
| WAX | 2 | 1 | 0 | 27.75 |
| WTC | 3 | 1 | 24 | 26.25 |
| XBT | 3 | 2 | 53 | 53.25 |
| XEM | 1 | 1 | 38 | 18.5 |
| XLM | 4 | 3 | 20 | 27.5 |
| XLQ | 1 | 1 | 61 | 54 |
| XLR | 2 | 2 | 55 | 36 |
| XN | 4 | 1 | 75 | 55 |
| XRH | 1 | 1 | 61 | 53.75 |
| XRP | 17 | 7 | 23 | 47.75 |
| XSN | 4 | 2 | 98 | 66.5 |
| XTL | 1 | 1 | 61 | 44 |
| XVG | 10 | 6 | 69 | 57 |
| XZC | 2 | 2 | 73 | 58 |
| ZAP | 1 | 1 | 38 | 38.75 |
| ZCL | 3 | 3 | 11 | 19.75 |
| ZEC | 2 | 2 | 76 | 66.75 |
| ZEN | 2 | 2 | 11 | 26 |
| ZIL | 6 | 4 | 73 | 77.75 |
| ZPT | 1 | 1 | 87 | 43.5 |
| ZRX | 10 | 4 | 15 | 50 |
The Influencers
Who am I?
I'm an investigative data journalist during the day, and I've been looking for a way to cut through the noise and get a true sense of what some of the biggest crypto influencers are pushing toward and pulling away from.
Using a pseudonym here because I can't post about this shit on my verified accounts. I've become mildly obsessed with crypto and its constant stream of data and needed an outlet. So here I am.
What is this?
Each week, I scrape the Twitter accounts of some of the crypto world’s favorite influencers, traders and TA folk. I run a sentiment analysis to see which coins they are mentioning positively, neutrally and which they are mentioning in a negative light.
I also take in data on unique influencers, retweets, favorites, volume and strength of feeling in sentiment.
I calculate power by through a weighted formula that takes into consideration volume, number of unique influencers and sentiment. The higher the score, the better, the lower the worse.
This isn’t financial advice, just my own way of trying to make sense of what’s out there. And as with most things, the more data I collect, hopefully, the more interesting it’ll be. This is a work in progress. Please leave suggestions on how to make it better. I imagine if I keep up with it, I’ll be able to expand a bunch of the analysis, but I wanted to start somewhere.
