Another month in the books and we're into the unofficial summer investement season
With yesterday's closing price at $0.135773, that's a wrap on the month of May, so it's time to post another set of monthly charts.
Also, as the unofficial start of summer in the United States, lets also call out the Memorial Day (May 26) closing price of $0.14466, too. Now, it's time to test the old cliché, "Sell in May and go away" once again.
For reference, here are STEEM prices on Memorial Day and Labor Day throughout the blockchain's history (barring errors with holiday dates from the AI or with transcription from me).
| Date | Close | Summer Change | Summer Direction | Winter Change | Winter Direction | Holiday |
|---|---|---|---|---|---|---|
| 2025-05-26 | $0.14 | -$0.02 | Down | Memorial Day | ||
| 2024-09-02 | $0.16 | -$0.12 | Down | Labor Day | ||
| 2024-05-27 | $0.28 | $0.13 | Up | Memorial Day | ||
| 2023-09-04 | $0.15 | -$0.03 | Down | Labor Day | ||
| 2023-05-29 | $0.19 | -$0.03 | Down | Memorial Day | ||
| 2022-09-05 | $0.22 | -$0.05 | Down | Labor Day | ||
| 2022-05-30 | $0.27 | -$0.34 | Down | Memorial Day | ||
| 2021-09-01 | $0.61 | $0.05 | Up | Labor Day | ||
| 2021-05-31 | $0.56 | $0.39 | Up | Memorial Day | ||
| 2020-09-07 | $0.17 | -$0.05 | Down | Labor Day | ||
| 2020-05-25 | $0.22 | $0.05 | Up | Memorial Day | ||
| 2019-09-02 | $0.17 | -$0.26 | Down | Labor Day | ||
| 2019-05-27 | $0.43 | -$0.56 | Down | Memorial Day | ||
| 2018-09-03 | $0.99 | -$1.16 | Down | Labor Day | ||
| 2018-05-28 | $2.15 | $0.90 | Up | Memorial Day | ||
| 2017-09-04 | $1.25 | $0.33 | Up | Labor Day | ||
| 2017-05-29 | $0.92 | $0.15 | Up | Memorial Day | ||
| 2016-09-05 | $0.77 | $0.34 | Up | Labor Day | ||
| 2016-05-30 | $0.43 | Memorial Day |
Summary Info:
- Summer Gains / Losses: 3 / 6
- Winter Gains / Losses : 5 / 4
With three consecutive summer downturns, maybe this will be the year that breaks the trend?
Before we get into the visualization, another point worth noting is that inflation has continued to be higher than typical this month due to ongoing conversions from SBDs to STEEM. As previously discussed, when large amounts of SBDs are converted to STEEM, that lowers the haircut price. In turn, the lower haircut price means that each remaining SBD is worth more STEEM. And that valuation change increases the virtual supply.
This month, conversion rates have been much slower than February, but they have still been high enough to keep reducing the haircut price and thereby increasing inflation. The haircut price is currently $0.16483.
It's counterintuitive, but if witnesses could pay enough SBD interest to stop people from converting SBD into STEEM, it might actually reduce the blockchain's overall inflation rate. Also, 54% of all SBDs are currently sitting in the SPS, so I guess more than half of that interest would eventually go to fuel Steem development.
Now, let's move on to the visuals.
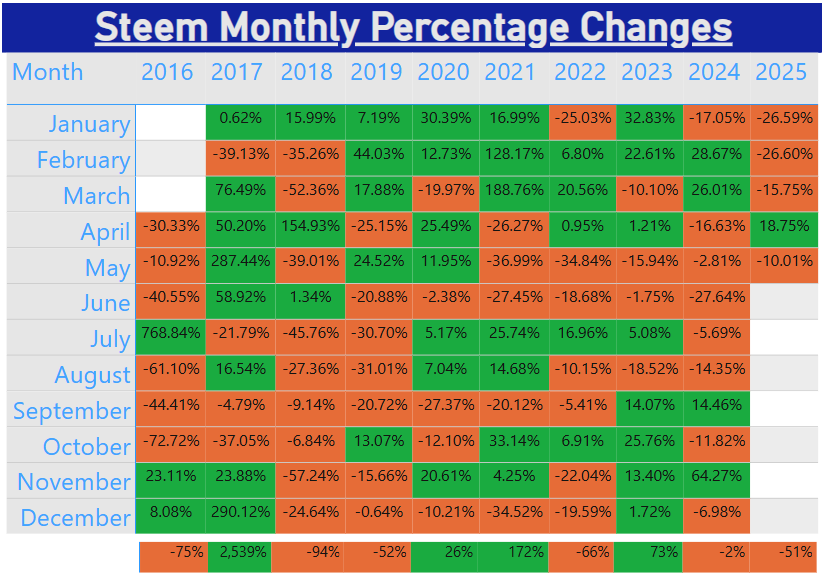
Here are the monthly changes, by percentage:
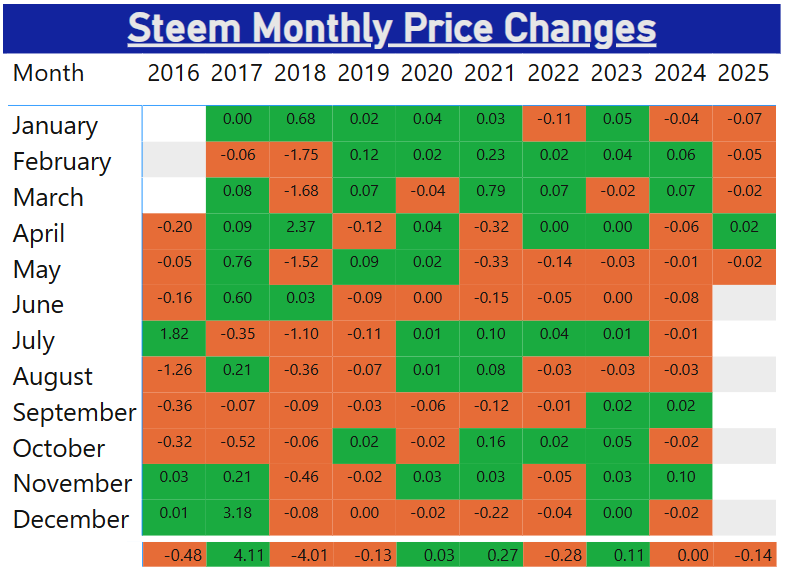
Here are the monthly changes, by value:
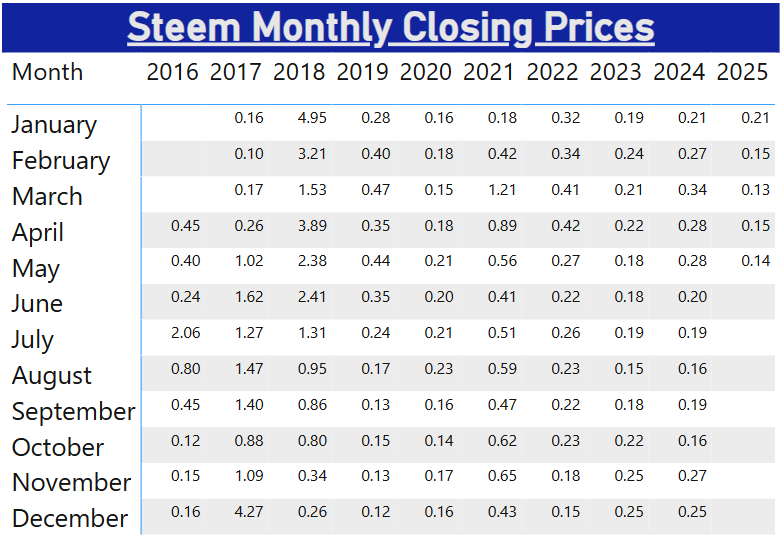
And here are the monthly closing prices
And here's a graph that I haven't posted before: Monthly percent change in an area graph.
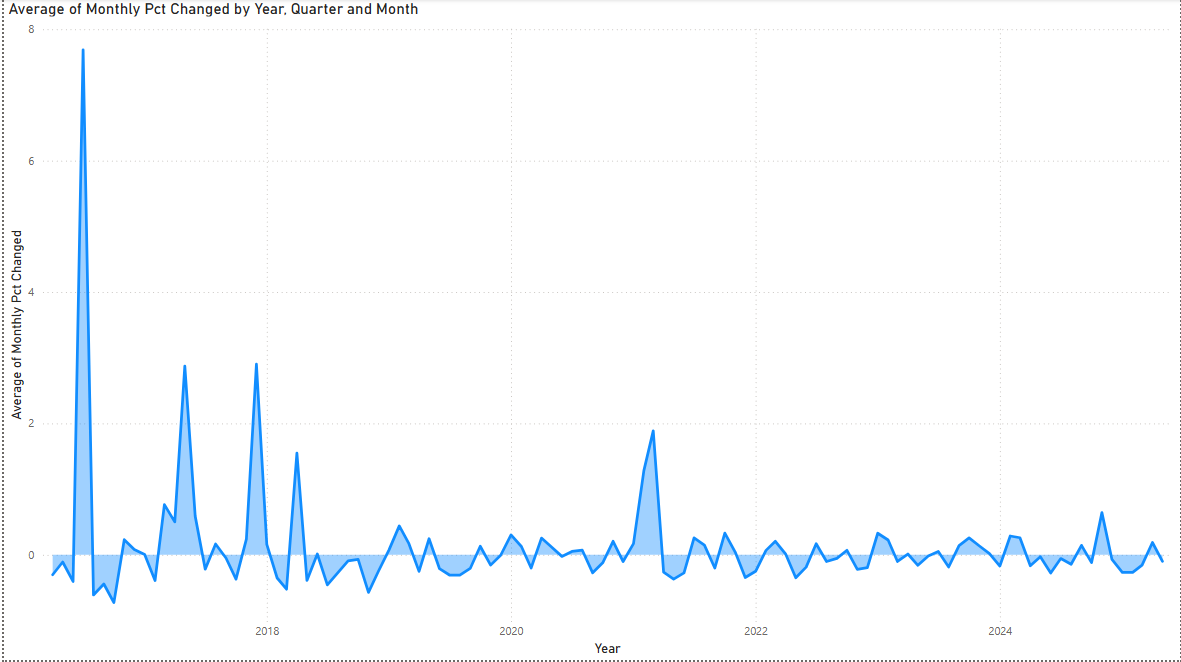
People think of crypto as a high-volatility investment, but this graph makes me think the opposite. Over time, it looks to me like the volatility is getting shaken out, and maybe Steem is starting to behave more like a dividend-paying stock?
Wrapping up
Two final questions: What do you think?
- Labor Day this year falls on September 1. Will the Labor Day closing price be over or under the Memorial Day closing price of $0.14466?
- Will the June 30 price be over or under the May 31 price of $0.135773?
If the bulk of activity on the chain is "passive income" bot-votes then it makes sense to not be treated like something that's growing in value.
Yeah, that's what I was thinking. It probably doesn't really matter if it's bot-votes or other forms of reward streams (I haven't looked, but I suspect that Hive's curve would look similar). Maybe investors are looking for steady, predictable returns more than growth. Just like dividend stocks vs. growth stocks.
Although, to be fair, we're still seeing swings of +/- 20-60% in the last year, so even if it's down from before, there's still a lot of volatility there.
Hey @remlaps-lite, thanks for keeping the Steem historical data coming! I always look forward to seeing your meticulous monthly price analysis. The "Sell in May and go away" angle, combined with the Memorial Day/Labor Day comparisons, is a clever way to frame the current market.
Your points about SBD conversions and their impact on inflation are fascinating and not something I see discussed enough! The visual representations of the data are top-notch, especially that new area graph showing the monthly percentage change. It definitely challenges the high-volatility narrative.
I'm leaning towards Labor Day being under $0.14466, but I'm optimistic that June 30 will close above May 31. What are your thoughts going into June? Anyone else have predictions?
Announcing the Open-Source Multi-Function Steemit Wallet!
I’m thrilled to introduce my latest project: BlazeScanner + Advanced Steemit Wallet – now fully open-source! 🎉
Read the full announcement here:
Steemit Post
🛠 Try the wallet live:
Steemit Wallet Demo
Features:
Feedback is welcome! Let’s build the future of Steem together.
#SteemDev #Crypto #OpenSource