You are viewing a single comment's thread from:
RE: Update On Profitability Of My Trading Strategy And STIXEX Ether Giveaway Program

Can you join me in analysing this chart?
too small right? can u enlarge from your side?
According to this trade in 1 day span, using your technique, there were 9 losses and 3wins
I did it wrongly didnt I
Anyway you said long term
Hi,
I can’t enlarge it, but from the dates in the bottom I can see that this is daily chart, on STIXEX you can only trade 30 minute charts. Therefore my strategy only applies to 30 minute candles.
I hope you can do a one time tutorial video
But even if you have used this strategy on daily charts the result in your picture would have been 6 wins and 7 losses. Not sure how you got 9 losses and 3 wins ?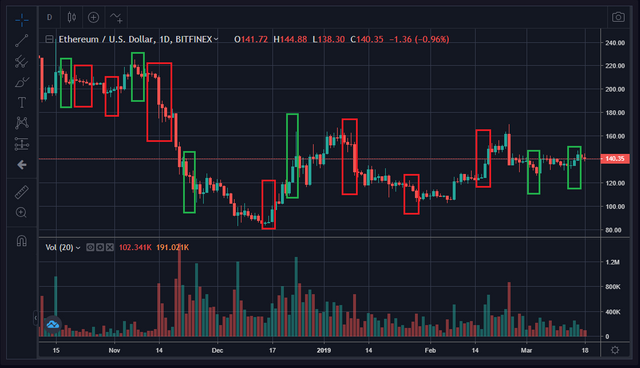
The strategy is very simple…Every-time when you see 3 candles of the same color in a row, you would place a bet on opposite color. So if you see 3 red candles in a row, you would bet that candle #4 will be green. That’s it.
Seen it now, quite a strategy. Thanks for the explanation