Monthly Cryptocurrency and ICO Market Analysis (July 2018)


This report presents data on cryptocurrency and ICO market changes during 2018. Special emphasis has been placed on an analysis of the changes that took place in July 2018.
Information as of August 6, 2018
Professor Dmitrii Kornilov, Doctor of Economics, Member of the Russian Academy of Natural Sciences, and Leading Analyst at ICOBox
Dima Zaitsev, PhD in Economics, Head of International Public Relations and Business Analytics Department Chief at ICOBox
Nick Evdokimov , Co-Founder of ICOBox
Mike Raitsyn , Co-Founder of ICOBox
Anar Babaev , Co-Founder of ICOBox
Daria Generalova, Co-Founder of ICOBox
Cryptocurrency Market Analysis (July 2018)
1. General cryptocurrency and digital assets market analysis. Market trends.
General cryptocurrency and digital assets market analysis (for the month).
1. General cryptocurrency and digital assets market analysis. Market trends.
General cryptocurrency and digital assets market analysis (for the month).
Table 1.1. Trends in capitalization of the cryptocurrency market and main cryptocurrencies from April 1, 2018, to August 5, 2018
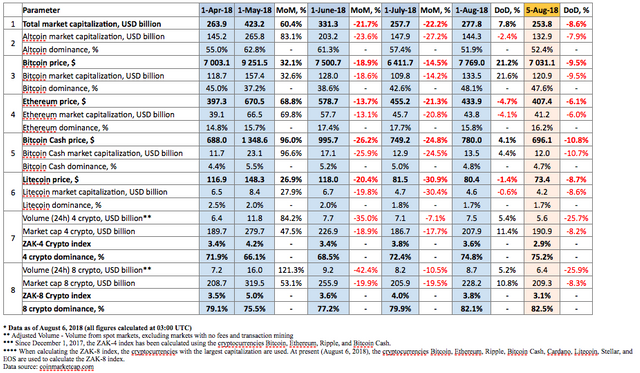
During July 2018 cryptocurrency market capitalization increased from $257.7 billion to $277.8 billion (as of 03:00 UTC), i.e. by $20 billion or 7.8% (see Table 1.1, Fig. 1). Bitcoin dominance grew noticeably during July, from 42.6% to 48.1%, meaning the increase in cryptocurrency market capitalization was basically due to the price growth of the leading cryptocurrency (by $23.7 billion), with the aggregate impact of altcoins on capitalization being negative (-$3.7 billion).
The dominance of the four and eight largest cryptocurrencies as of 03:00 UTC on August 1, 2018, equaled 74.8% and 82.1%, respectively.
During July cryptocurrency market capitalization fluctuated from $243.6 billion (min) to $303.3 billion (max) (Fig. 1a), i.e. within a range of $60 billion. For its part, bitcoin capitalization fluctuated from $106 billion (min) to $143.6 billion (max), i.e. within a range of $37.6 billion.
The first days of August (August 1-5, 2018) saw the latest downward adjustment to $253.8 billion (as of 03:00 UTC on August 5, 2018).
The most significant changes in cryptocurrency market capitalization since the start of July 2018 are shown in Fig. 1a. Some of these changes can be tied to a number of events (see the comments below and in Table 1.4).
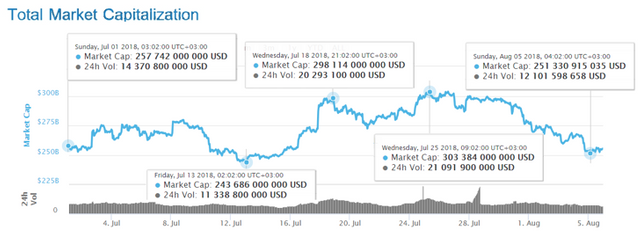
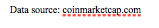
Figure 1a. Cryptocurrency market capitalization since July 1, 2018
Figure 1b shows bitcoin capitalization (red line) superimposed on cryptocurrency market capitalization (blue line). The lines are practically identical up to July 18, but the gap between them starts to widen after this date. This is due to increased bitcoin dominance and its faster price growth compared to the prices of most altcoins. This time, however, bitcoin did not pull the entire market along with it, if anything the opposite, and by August 5 capitalization had fallen below the level at the beginning of July.
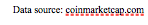
Figure 1b. Capitalization of the cryptocurrency market (blue) and bitcoin (red) since July 1, 2018
Price trends of the cryptocurrency market leaders during July 2018
Table 1.2 presents the price trends of 10 cryptocurrencies in July 2018 (not including Tether). The price fluctuations ranged from 21% to 94% (High/Low). Ethereum, Ripple, and Litecoin showed the most stable prices of the ten presented currencies. For example, the range of price fluctuations of Ethereum (High/Low: 513.43/422.81=1.21) and Ripple (High/Low: 0.52/0.43=1.21) equaled 21%. Stellar and Cardano experienced the most significant fluctuations. The high and low prices for these cryptocurrencies differed by a factor of 1.5, and ranged from $0.18 to $0.35 and from $0.12 to $0.19, respectively (see Table 1.2).
Table 1.2. Price changes in the top 10 cryptocurrencies by capitalization during the period from July 1-August 1, 2018
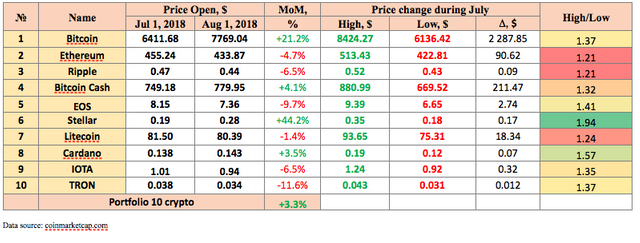
Thus, during July 2018 the price change of the leading cryptocurrencies by capitalization compared to the start of the month (Fig. 2) ranged from -11.6% (TRON) to +44.2% (Stellar). The average portfolio return (Portfolio 10 crypto) for July for a portfolio consisting of equal shares of the top 10 cryptocurrencies was insignificant, and equaled +3,3%. Overall, cryptocurrency market capitalization increased during July from $257.7 billion to $277.8 billion, i.e. by 7.8%.
(on the left the cryptocurrencies are ranked by the level of price depreciation over the month, and on the right – by the amount of capitalization as of August 1, 2018)
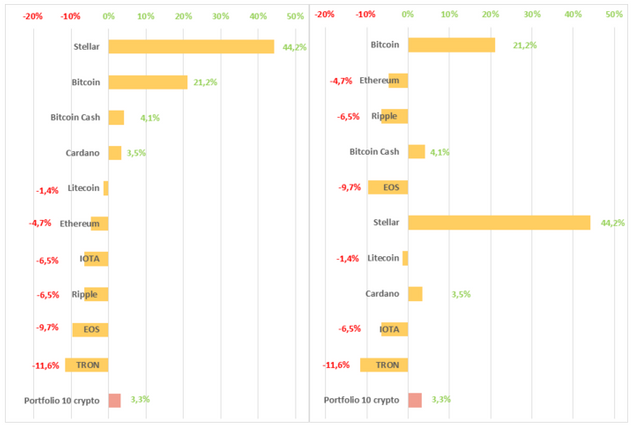
Figure 2. Price change in the top 10 cryptocurrencies by capitalization during July 2018 (not including Tether), %
The value of a portfolio consisting of the top 10 cryptocurrencies by capitalization remained practically the same during July, showing a 3.3% growth despite the fact that the price of six of the 10 cryptocurrencies fell. The price drops were not huge, and ranged from 1.4% for Litecoin to 11.6% for Tron. EOS and Tron showed the worst performance indicators. Tron continued its downward adjustment, which started several months ago after a jump in price in late April, while the depreciation of EOS can be explained by the discovery of vulnerabilities in the code of the main network.
The other four cryptocurrencies increased in price, but the gains of Cardano and Bitcoin Cash were not significant (the prices of the coins changed by a mere 3.5% and 4.1%, respectively).
The biggest gainers during the month were Bitcoin and Stellar. On Tuesday, July 24, the price of the first cryptocurrency passed the psychological barrier of $7,800, and then $8,000, thereby consolidating the gains that were achieved throughout the previous week. However, the bitcoin price subsequently fell below $8,000 on the news that the SEC had once again rejected the bitcoin ETF proposal of the Winklevoss brothers (https://www.coinspeaker.com/2018/07/27/bitcoin-slips-below-8000-as-sec-rejects-bitcoin-etf-proposal-from-winklevoss-twins/).
The main news items for Stellar this month were rumors on its possible listing on Coinbase, as well as its partnership with IT giant IBM, which chose the Stellar platform for the creation of its cryptocurrency (https://www.forbes.com/sites/panosmourdoukoutas/2018/07/21/bitcoin-and-stellar-get-a-big-boost-from-ibms-stable-coin/#334321351843), as well as the news that Stellar was the first cryptocurrency approved by Sharia law, which might cause spikes in demand on the part of the Islamic population (https://cointelegraph.com/news/stellar-becomes-first-sharia-certified-blockchain-for-payments-and-asset-tokenization)
Calculation of the index of trading activity on cryptocurrency exchanges
To analyze trading activity on cryptocurrency exchanges, the ZAK-n Crypto index is calculated (see the Glossary). In early August the 24-hour trading volumes (Volume 24h) for the four and eight dominant cryptocurrencies were approximately half of what they were in early May, and roughly equal to the amounts in early June (Table 1.1).
The values of the ZAK-4 Crypto indices are presented in Tables 1.1 and 1.3. In May the 24-hour trading volumes (Volume 24h) for the four dominant cryptocurrencies (Bitcoin, Ethereum, Bitcoin Cash, Ripple) equaled from $4.6 billion to $10.8 billion (Table 1.3). The value of the daily ZAK-4 Crypto fluctuated from 2.5% to 5.2% of capitalization. The highest trading volume was seen on July 24. One of the reasons for the increased activity was the expectation of decisions from the US Securities and Exchange Commission (SEC) on applications on the launch of bitcoin ETFs, specifically two (1, 2) official announcements of the SEC. Activity gradually fell after the publication of these announcements, and by August 5 the 24-hour trading volumes for the four dominant cryptocurrencies equaled $5.6 billion, i.e. 2.9% of their market capitalization (Table 1.3).
Table 1.3. Daily ZAK-4 Crypto index calculation (from July 1, 2018, to August 5, 2018)
Table 1.3 shows the adjusted trading volumes (Adjusted Volume*). However, if you take into account all data on cryptocurrency trading, the indicators would be much higher. This is due to the growing popularity of fee mining. New cryptoexchanges have unexpectedly started to shoot to the top in terms of trading volumes. Specifically, the Singapore-based BitForex cryptoexchange (registered in the Seychelles), trading on which began in June 2018, is already the outright leader in trading volume (see Fig. 3b). Last week the 24-hour trading volume on BitForex exceeded $14 billion, and on July 26 the Volume 24h on CoinBene and Bit-Z equaled nearly $2 and $1.5 billion, respectively, surpassing the trading volumes on Binance. Before the launch of the trans-fee model, Binance had been the leading cryptoexchange by 24-hour trading volume, which equaled around $1 billion.
The trans-fee model (or Trade-to-mine, Trans-fee mining) proposes the issue of tokens to traders by exchanges as a reward for trading. This mechanism allows traders to lower the cost of trading, and the exchange to quickly attract new clients and increase turnover. Trading platforms distribute their tokens, which traders can use to pay transaction fees or for sale in the future. For example, BitForex (BF) returns 80% of its transaction fees to the owners of BF tokens.
As reported by cryptoglobe, with reference to Binance CEO Zhao Changpeng, the Trans-fee model represents a disguised initial coin offering, with the CEO stating that: “If an exchange doesn't get revenue from transaction fees and solely profits from the price of its token, how would it survive without manipulating the token price? Are you sure you want to play against a price manipulator? The same price manipulator who controls the trading platform?"
Figures 3a and 3b show the rating of cryptocurrencies by trading volumes with and without the adjustment, according to the data of coinmarketcap.
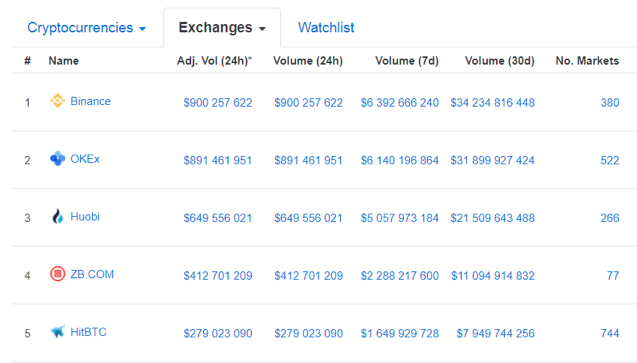
Figure 3a. Top 5 cryptocurrencies by 24-hour trading volume with adjustment
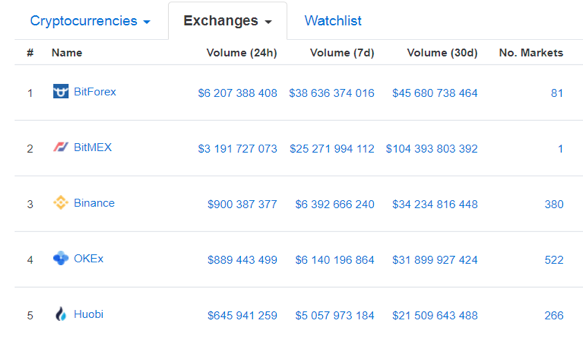
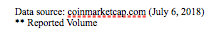
Figure 3b. Top 5 cryptocurrencies by 24-hour trading volume
Table 1.4 shows the main events that took place since the start of July 2018 that had an impact on both the prices of the dominant cryptocurrencies and the market in general, with an indication of their nature and type of impact.
Table 1.4. Key events having an influence on cryptocurrency prices in July and early August 2018
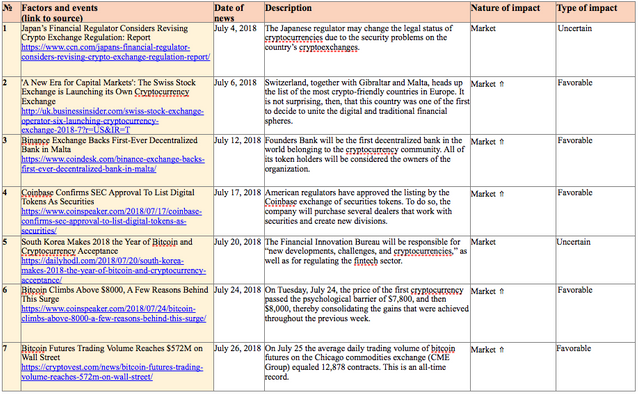
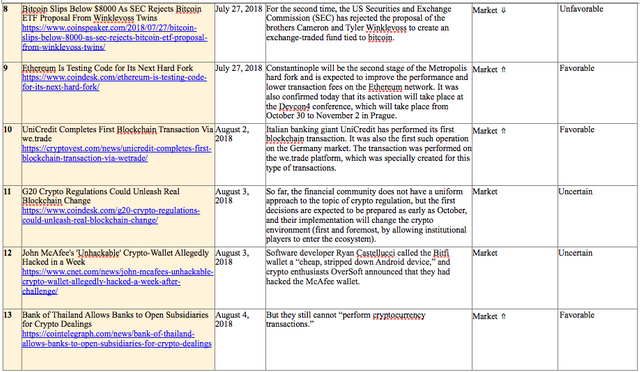
Most of the events in July had a positive impact on the cryptocurrency market, leading to its growth. As already noted, July saw an increase in bitcoin dominance on the cryptocurrency market from 42.6% to 48.1%. An important problem for the cryptocurrency market is decentralization, including in the cryptocurrency mining process. The share of the largest mining pools (BTC.com and Antpool) in the overall hash rate of the bitcoin network is being widely discussed, as it reached 42-43% in July according to coin.dance. In our previous report we mentioned the largest Chinese crypto mining company Bitmain, which was appraised at $12 billion, and the value of which might increase to $15 billion by the end of July after the completion of the next round of financing (series C) with the attraction of another $1 billion. The crypto mining giant Bitmain owns Antpool, and also controls BTC.com. Figure 4 shows data on bitcoin mining and indicates the share of the hash rate of the first cryptocurrency network accounted for by various pools on July 30 and August 6.
Figure 4. Bitcoin mining and the share of mining pools
According to the data of CoinDance, on July 30 the BTC.com and Antpool mining pools belonging to the crypto mining giant Bitmain accounted for 19.8% and 12.8% of all bitcoin blocks, respectively, and on August 6 – for 22.22% and 16.67%. Therefore, the company that controls them has access to around 32.6-38.9% (and previously 42-43%) of the hash rate of the first cryptocurrency network. Sharp changes in the shares of companies may be associated with the partial transfer of capacity for the mining of Bitcoin Cash (BCH), since bitcoin and BCH have an identical algorithm.
In other words, it is safe to say that China and its companies have a considerable impact on the bitcoin mining process. TheStreet summed up the results of the conference Insight Conference Stifel Financial 2018. According to Ripple CEO Brad Garlinghouse, bitcoin is controlled by China, which is why the largest pools for its mining are found there.
During a downward adjustment on the cryptocurrency market there is usually a fairly close correlation between the overall trend and the prices of most cryptocurrencies. According to the resource sifrdata.com (Fig. 5), this close correlation has been seen over the past three months between the indicators of crypto market leaders Bitcoin, Ethereum, Ripple, Bitcoin Cash, and Litecoin and the other cryptocurrencies (area highlighted in red).
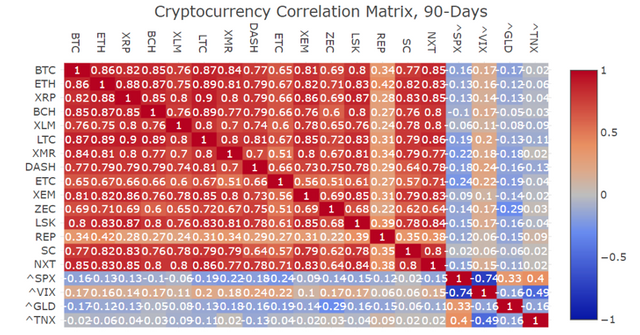
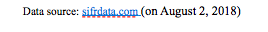
Figure 5. Correlation between cryptocurrencies
It is thought that the closer the correlation coefficient is to 1, the higher the similarity of changes in cryptocurrency price trends. If the coefficient is around zero, there is no correlation between the indicators. If the indicator is around -1, there is an inverse relationship.
In the blue zone there is no correlation. Therefore, no direct dependency between the cryptocurrencies and the S&P 500 Index (^ SPX), the CBOE volatility index (^ VIX), the shares of SPDR Gold (^ GLD), and CBOE 10-year treasury bonds (^ TNX) was seen over the past 90 days.
Table 1.5 gives a list of events that could impact both the prices of specific cryptocurrencies and the market in general.
Table 1.5. Events that could have an influence on cryptocurrency prices in the future
1.2. Market trends
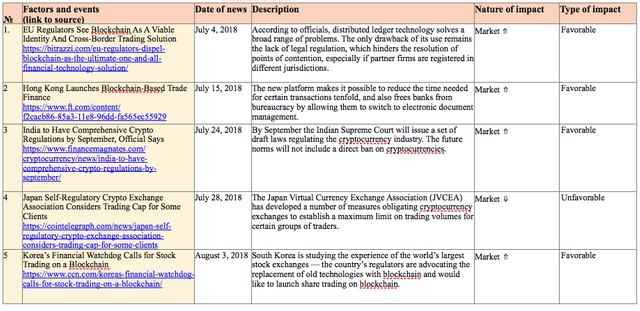
The weekly cryptocurrency and digital asset market trends from December 31, 2017, to August 5, 2018, are presented as graphs (Fig. 1.1-1.5).
Table 1.6. Legends and descriptions of the graphs
Figure 1.1. Total cryptocurrency market capitalization (weekly trend)
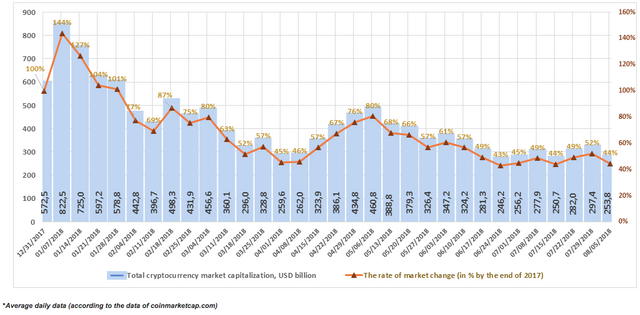
Figure 1.1 shows a graph of the weekly cryptocurrency market change from December 31, 2017, to August 5, 2018. Over this period, market capitalization dropped from $572.5 billion to $253.8 billion, i.e. by 56%. Last week (July 29-August 5, 2018) cryptocurrency market capitalization decreased from $297.4 billion to $253.8 billion (as of August 5, 2018, based on the average figures from coinmarketcap.com).
Figure 1.2. Change in market capitalization (weekly trend)
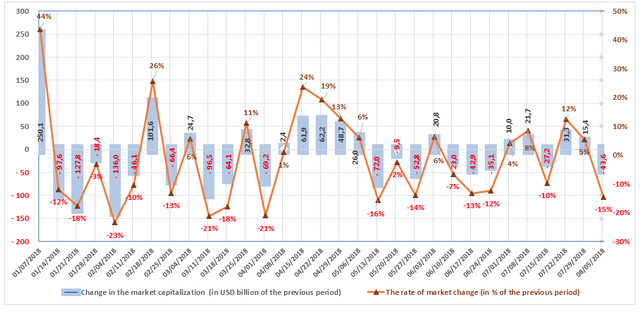
The market is susceptible to sudden and drastic fluctuations. During the first week of January, market capitalization increased by approximately $250 billion, or 44%. The largest weekly fall in the first quarter of 2018 was $136 billion, or 23%, during the week of January 28-February 4, 2018.
Nine of the thirteen weeks in the first quarter of 2018 were “in the red”, i.e. capitalization fell based on the results of each of these weeks.
Six of the thirteen weeks in the second quarter were “in the red.” The market grew based on the results of the other seven weeks. As noted earlier, a growth was seen in April, while in May and June there was generally a reduction in capitalization. The weekly fluctuations ranged from USD -72 billion to USD +62.2 billion.
Three of the past five weeks in the third quarter have shown a growth in capitalization (with due account of average daily data of coinmarketcap.com, see Fig. 1.2).
Figure 1.3. Number of cryptocurrencies and digital assets (weekly trend)
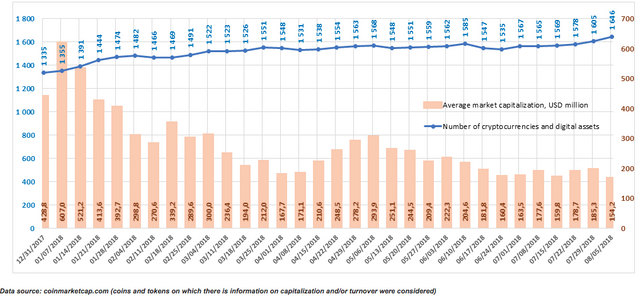
Since December 31, 2017, the total number of cryptocurrencies and digital assets considered when calculating market capitalization has increased from 1,335 to 1,646. Over the past week their number increased from 1,605 to 1,646, i.e. by 41, and average capitalization fell to $154.2 million. In total, over the past month 151 new coins and tokens have appeared on coinmarketcap.com. However, it should be noted that a number of other coins and tokens were also excluded from the list. Among the tokens that were added to coinmarketcap.com last week, BHPCash, Six Domain Chain, Vexanium, Webcoin, ATC Coin, BitKan, and VeThor Token showed high trading volumes.
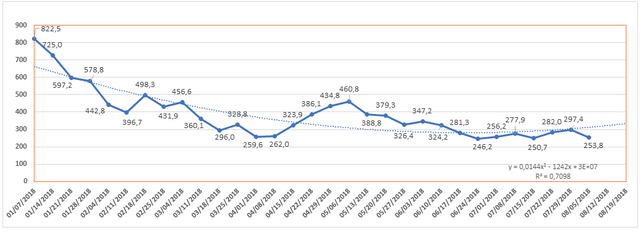
Figures 1.4 and 1.5. Forecast of total cryptocurrency market capitalization
CoinDesk presented the position of UBS Investment Bank, which believes that at present bitcoin is neither money nor a viable asset class. However, they confirm that if bitcoin can resolve its scalability problem and receive regulatory support, it could become a “viable payment mechanism and/or a legitimate asset class in which even the most conservative and traditional investors can participate.”
Business insider Nordic writes that in its report the Goldman Sachs investment strategy group says that the bitcoin price will continue to decline. “Our view that cryptocurrencies would not retain value in their current incarnation remains intact and, in fact, has been borne out much sooner than we expected,” the team led by Chief Investment Officer Sharmin Mossavar-Rahamani said.
According to economist and investor Tuur Demeester, the bitcoin price will not hit an all-time high in 2018, but he is confident in its growth over the long term.
There were also previous reports with more optimistic opinions. It its Twitter program CNBC's Fast Money, the television channel CNBC presented an interview with BitMEX cryptoexchange CEO Arthur Hayes. He feels that bitcoin has “hit bottom,” and believes that the cryptocurrency price could rise to $50,000 by the end of the year. NewsBTC reports, with a reference to a group of researchers, that with the appearance of bitcoin exchange-traded funds (ETF) the price of the first cryptocurrency could find itself in the range of $25,000 to $44,000. Exchange-traded funds could quickly ensure a new inflow of financial funds into this market segment.
ICO Market Analysis (July 2018)
1. General analysis of the ICO market (for July 2018)
1.1. Brief overview of ICO market trends
1. General analysis of the ICO market (for July 2018)
1.1. Brief overview of ICO market trends
Table 1.1. Brief ICO market overview, key events, and news during July and early August 2018
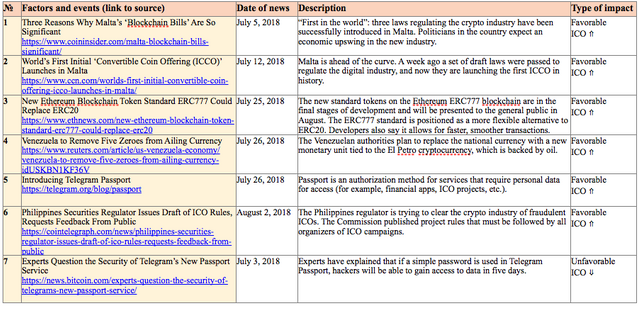
Table 1.2 shows the development trends on the ICO market since the beginning of the second quarter of 2018. Only popular and/or successfully completed ICOs (i.e. ICOs which managed to collect the minimum declared amount of funds) and/or ICOs listed on exchanges were considered.
Table 1.2. Aggregated trends and performance indicators of past (completed) ICOs1,2,3
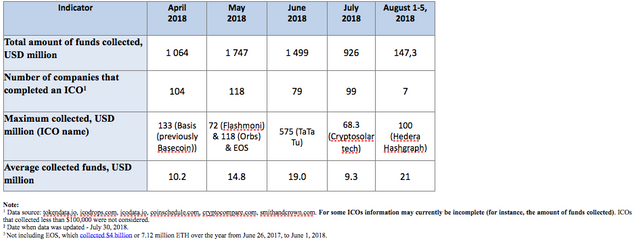
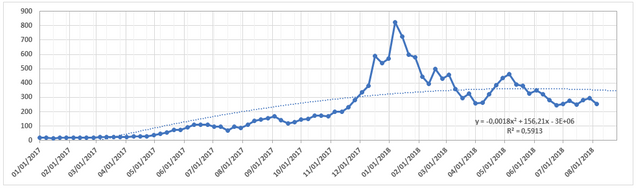
During July 2018 the amount of funds collected via ICOs equaled $926 million. This amount consists of the results of 99 successfully completed ICOs, with the largest amount of funds collected equaling $68.3 million (Cryptosolartech ICO). The average collected funds per ICO project equaled 9.3 million (see Tables 1.2, 1.3). A total of more than 200 ICOs were completed last month.
In early August (August 1-5, 2018) more than $147.3 million have been collected, with the blockchain startup Hedera Hashgraph accounting for the lion’s share ($100 million).
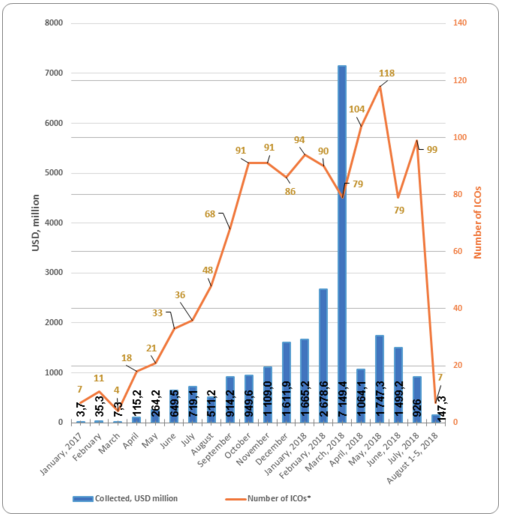
Table 1.3. Amount of funds collected and number of ICOs
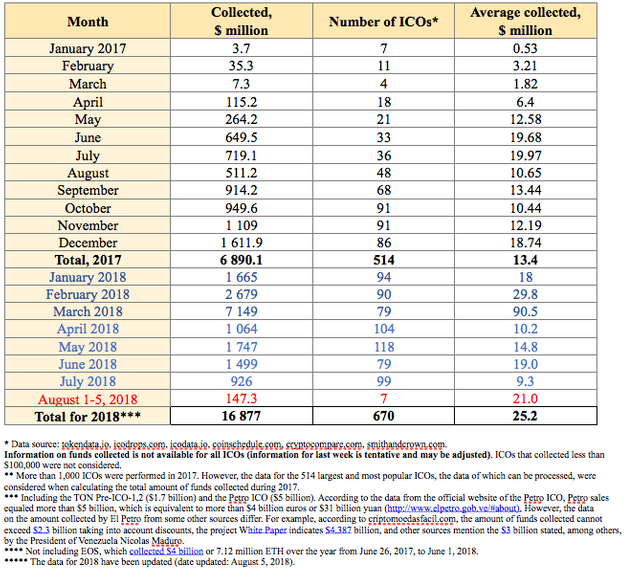
Table 1.3 shows that the largest amount of funds was collected via ICOs in March 2018, mainly due to the appearance of major ICOs. The highest average collected funds per ICO was also seen in March 2018.
Figure 1.1. Trends in funds collected and number of ICOs since the start of 2017
1.2 Top ICOs during July 2018
Table 1.4. Top 20 ICOs by the amount of funds collected during July 2018
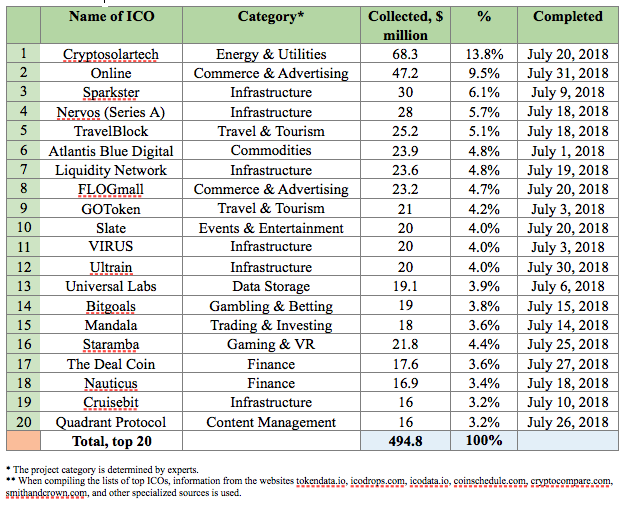
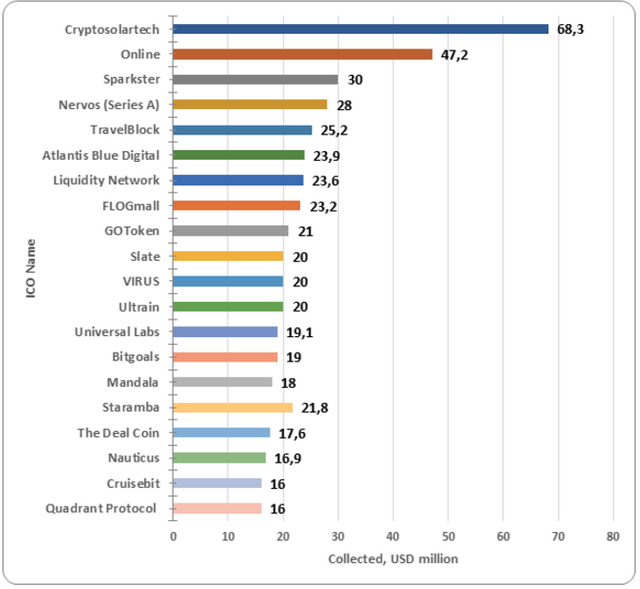
Table 1.4 shows the top 20 largest ICOs by the amount of funds collected, most of which belong to the Infrastructure, Energy & Utilities, Commerce & Advertising, Travel & Tourism, Finance, and Trading & Investing categories.
July’s leader was the Cryptosolartech project, which is involved in cryptocurrency mining. This project’s goal is to collect funds for the construction of a photovoltaic electricity power station with a capacity of 45,000 kW, based on the conversion of solar energy. Funding of conversion of solar energy could be profitable, provided construction and equipment costs are lowered and the performance of the electrical equipment is improved.
Figure 1.2. Top 20 ICOs by the amount of funds collected during July 2018
1.3. Top ICOs of last week (July 30-August 5, 2018)
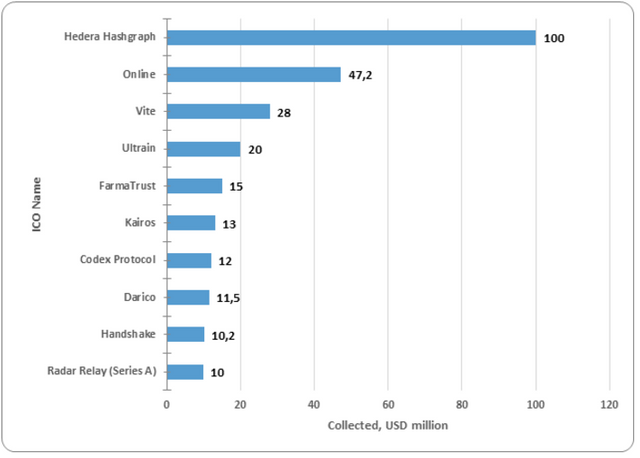
Table 1.5 shows the ten largest ICOs of the week.
Table 1.5. Top 10 ICOs by the amount of funds collected (July 30-August 5, 2018)
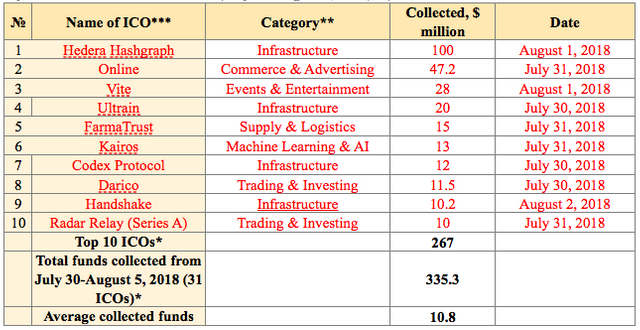

The data for the previous period (July 30-August 5, 2018) may be adjusted as information on the amounts of collected funds by completed ICOs is finalized. Over the past week (July 30-August 5, 2018) the amount of funds collected via ICOs equaled $335.3 million. This amount is made up of the results of 31 successfully completed ICOs.
The leader of the week was the Hedera Hashgraph project, which collected $100 million from institutional and other major individual backers. As reported by coindesk, Hedera Hashgraph had already previously collected $18 million through a private token sale, and in the future the startup plans to hold another public ICO (crowdsale) with a hard cap of $20 million for accredited backers.
The Hedera Hashgraph project stipulates the use of hashgraph technology, which is based on a distributed consensus algorithm. Hashgraph technology differs in a number of ways from blockchain technology, and is aimed at solving the following problems: productivity; security; stability; management and compliance with regulatory requirements. “The platform is lightning fast, fair, and secure and, unlike some blockchain-based platforms, doesn’t require compute-heavy proof-of-work. Hedera enables and empowers developers to build an entirely new class of decentralized applications that were never before possible.” In the future the platform will enable the launch of DApps and smart contracts.
Figure 1.3 presents the ten largest ICOs completed during the past week.
Figure 1.3. Top 10 ICOs by the amount of funds collected (July 30-August 5, 2018)
1.4. Top ICOs in the Infrastructure category
The list of top ICOs by category is compiled with due account of the categories of the leading ICOs for the month and the week. The Hedera Hashgraph project was among the top 10 largest projects by the amount of funds collected in the Infrastructure category (Table 1.6).
Table 1.6. Top 10 ICOs by the amount of funds collected, Infrastructure category
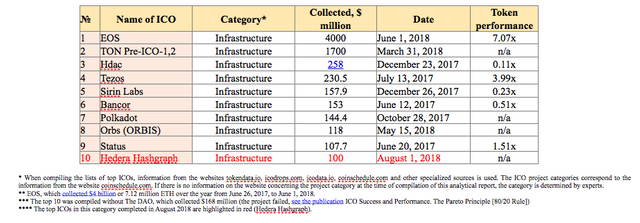
At present, all projects from the top 10 in this category have a token performance indicator of 0.11x to 7.07x. The most successful ICO by the amount of funds collected and the most successful exchange listing among the ten presented is the EOS project, as its collected funds are estimated to exceed $4 billion and it has a current token price to token sale price ratio of 7.07x. When analyzing this project, it is important to remember the long duration of the EOS ICO (from June 26, 2017, to June 1, 2018) and the fact that the token price was constantly changing during the ICO. Over the first five days of the ICO 200,000,000 EOS tokens were sold, and another 2,000,000 coins were sold every 23 hours thereafter. The token performance indicator for EOS in Table 1.6 was determined based on a calculation in which the token sale price of 1 EOS during the ICO equaled USD 0.99, and the current token price of 1 EOS was equal to USD 7. EOS’s market capitalization currently exceeds $6.3 billion.
Figure 1.4. Top 10 ICOs by the amount of funds collected, Infrastructure category
During July 2018 more than $926 million were collected (made up of the results of 99 successfully completed ICOs), and over the first five days of August nearly another $150 million has been collected. July’s leader was the Cryptosolartech project, which collected $68.3 million. The completion of a new round of financing of the blockchain startup Hedera Hashgraph, which collected $100 million, was announced on August 1. The total amount of funds collected by a number of ICOs failed to reach even $100,000 (the information for some projects is still being finalized). The total number of ICOs held during the analyzed period was more than 200.
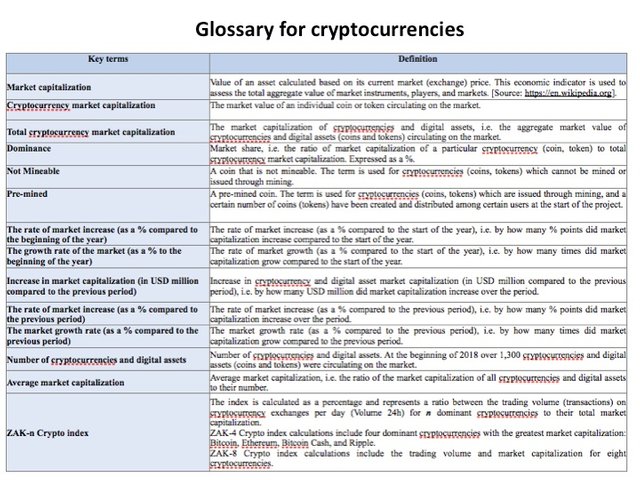
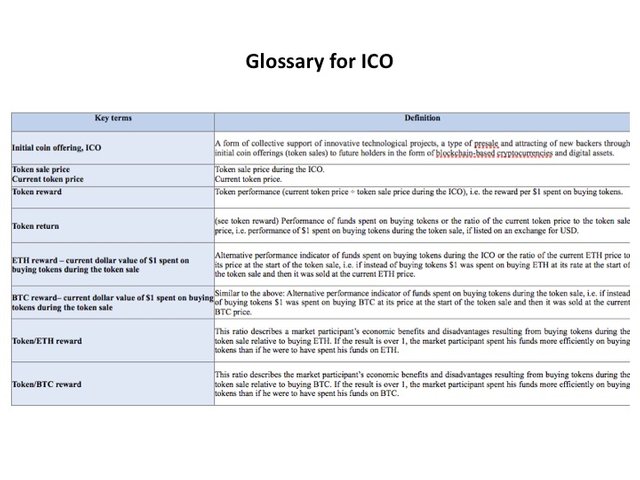
The Glossary is given in the Annex.
Annex
Glossary
Hi! I am a robot. I just upvoted you! I found similar content that readers might be interested in:
https://www.coinspeaker.com/2018/08/07/monthly-cryptocurrency-market-analysis-july-2018/