Cryptocurrency and ICO Market Analysis (September 9-16, 2018)

This report presents data on cryptocurrency and ICO market changes during 2018. Special emphasis has been placed on an analysis of the changes that have taken place during September 2018, including over the past week (September 9-16, 2018).
Information as of September 17, 2018
Professor Dmitrii Kornilov, Doctor of Economics, Member of the Russian Academy of Natural Sciences, and Leading Analyst at ICOBox
Dima Zaitsev, PhD in Economics, Head of International Public Relations and Business Analytics Department Chief at ICOBox
Nick Evdokimov , Co-Founder of ICOBox
Mike Raitsyn , Co-Founder of ICOBox
Anar Babaev , Co-Founder of ICOBox
Daria Generalova, Co-Founder of ICOBox
Cryptocurrency Market Analysis (September 9-16, 2018)
1. General cryptocurrency and digital assets market analysis. Market trends
1.1. General cryptocurrency and digital assets market analysis
1. General cryptocurrency and digital assets market analysis. Market trends
1.1. General cryptocurrency and digital assets market analysis
Table 1.1. Trends in capitalization of the cryptocurrency market and main cryptocurrencies from April 1, 2018 to September 16, 2018

Cryptocurrency market capitalization increased over the analyzed period (September 9-16, 2018), and as of 03:00 UTC equaled $203.4 billion (see Table 1.1). In this regard, bitcoin dominance equals 55.5%. The market dominance of the four and eight largest cryptocurrencies as of 03:00 UTC on September 16, 2018, equaled 76% and 82.9%, respectively (see Table 1.1).
The drop in cryptocurrency market capitalization compared to the start of the month equaled around $25 billion, including a drop in bitcoin capitalization by $8.5 billion and altcoin capitalization by $16.5 billion.
During the period from September 9-16, 2018, cryptocurrency market capitalization fluctuated from $186.2 billion (min) to $204.7 billion (max) (Fig. 1a), i.e. within a range of $18.5 billion. For its part, bitcoin capitalization fluctuated from $107 billion (min) to $113.8 billion (max), i.e. within a range of $6.8 billion.


Figure 1a. Cryptocurrency market capitalization since September 9, 2018
Figure 1b shows bitcoin capitalization (red line) superimposed on cryptocurrency market capitalization (blue line). The high correlation between the indicators is obvious. This synchronicity has been seen for more than four months already, with a steady growth in bitcoin dominance. Since the start of May, bitcoin dominance has increased from 36% to 55.5%.


Figure 1b. Capitalization of the cryptocurrency market (blue) and bitcoin (red) since September 9, 2018
The factors that might have influenced the fall in capitalization on September 11-12 are:
- The SEC suspended trading in bitcoin and Ethereum ETN
- Bloomberg: Has the largest holder of bitcoin started to sell?
- The US Securities Act may be used for court prosecution of cases of ICO fraud
A clear downward trend can be seen on September 17 (Fig. 1a, 1b). Capitalization fell by nearly $10 billion. We may find out the real reasons for this at a later date. It is entirely possible that, as reported by The Telegraph, the payment program of the bankrupt bitcoin exchange Gox may lead to the sale of 160,000 bitcoins to pay creditors an amount of $1 billion, since the cryptocurrency market participants who lost their money must file a claim by October 22.
The rise and fall of cryptocurrency prices over the past seven days (September 9-16, 2018)
Last week’s leaders from among the top 500 cryptocurrencies by capitalization that showed the growth of more than 100% were the projects Vitae (+165.63%), VIBE (+105.55%), ETERNAL TOKEN (+102.93%), and OneRoot Network (+100.43%). The growth of Cindicator (+93.62%) and FuzeX (+63.80%) should also be noted.
During the period from September 9-16, 2018, the change in the prices of cryptocurrencies in the top 500 ranged from -47.62% (Namecoin) to +165.63% (Vitae). Namecoin already lost most of its holders a long time ago, and disappeared from the radar of large media outlets. The fall in its price might be due to the overall negative market trend in the price of altcoins or the exit of a major holder.
The price of the Vitae token is hard to tie to any specific news item, since its trading volume at the start of the week was around $20,000, and after its 24-hour trading volume reached more than $100,000 for several days, by the end of the week the trading volume had settled back to around $30,000. The growth in the price against the backdrop of small trading volume might even be due to the increased activity of the community as a result of the recently launched bounty program.
The price of 309 cryptocurrencies and digital assets from the top 500 showed growth, including 56 from the top 100.
Over the past week the number of cryptocurrencies with a capitalization of more than $1 billion remained the same at 15, with the price of all of them increasing except Bitcoin Cash (-7.05%), Cardano (-11.43%), NEO (-1.27%), and Tether (the price of which is tied to the US dollar).
The coins and tokens from the top 100 that demonstrated the largest price growth are given in Fig. 2.
Biggest gainers and losers over the week (September 9-16, 2018)
The prices of some cryptocurrencies may fluctuate from -50% to +50% over the course of a single day. Therefore, when analyzing cryptocurrency price trends, it is advisable to use their average daily amounts on various cryptoexchanges.
Below we consider the 10 cryptocurrencies that demonstrated the most significant change in price over the past week (Fig. 2-3). In this regard, only those coins and tokens included in the top 100 (Fig. 2, Fig. 3) by market capitalization were considered2.
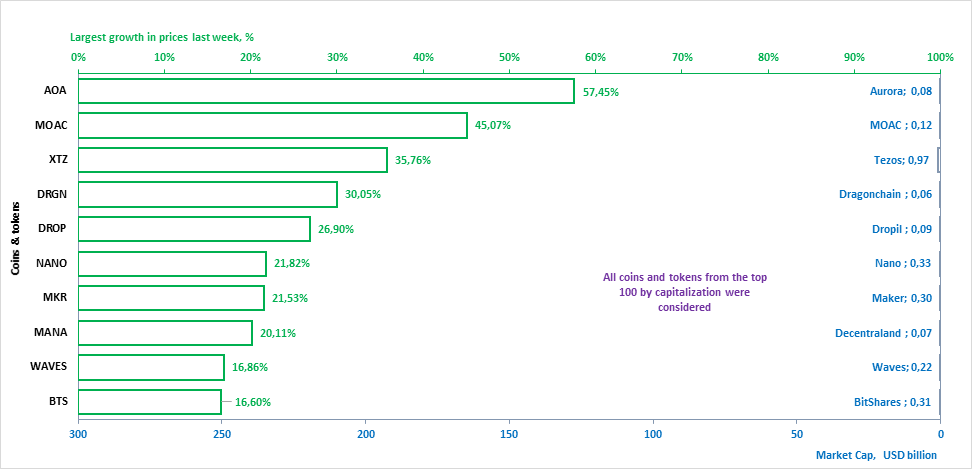
Figure 2. Largest growth in prices over the past week
Tables 1.2 and 1.3 show the possible factors or events that might have influenced the fluctuation in prices for certain cryptocurrencies. Table 1.4 shows the possible factors or events that might have influenced the cryptocurrency market in general.
Table 1.2. Factors or events that might have led to a growth in cryptocurrency prices over the past week

A depreciation in price was seen last week for 191 coins and tokens from the top 500 cryptocurrencies and digital assets by capitalization. The ten crypto assets from the top 100 that experienced the most noticeable drops in price are shown in Fig. 3 and Table 1.3.

Figure 3. Largest fall in prices over the past week
Table 1.3. Factors or events that might have led to a fall in cryptocurrency prices over the past week


Table 1.4 shows events that took place from September 10-16, 2018, that had an impact on both the prices of the dominant cryptocurrencies and the market in general, with an indication of their nature and type of impact.
Table 1.4. Key events of the week having an influence on cryptocurrency prices, September 10-16, 2018

To analyze trading activity on cryptocurrency exchanges, the ZAK-n Crypto index is calculated (see the Glossary). The values of the ZAK-4 Crypto and ZAK-8 Crypto indices are presented in Tables 1.1, 1.5.a, and 1.5.b. In September the 24-hour trading volumes (Volume 24h) for the four dominant cryptocurrencies (Bitcoin, Ethereum, Bitcoin Cash, Ripple) equaled from $5.3 billion to $9.1 billion (Table 1.5.a). The value of the daily ZAK-4 Crypto ranged from 3.4% to 5.2% of capitalization. The highest trading volume was seen on September 5-6.
Table 1.5.a. Daily ZAK-4 Crypto index calculation (from September 1-16, 2018)


By the end of the week the 24-hour trading volumes (Volume 24h) for the eight dominant cryptocurrencies not including Tether (Bitcoin, Ethereum, Bitcoin Cash, Ripple, Litecoin, Stellar, EOS, and Monero) equaled $6.1 billion (Table 1.5.b), or 3.6% of their market capitalization. The ZAK-4 Crypto and ZAK-8 Crypto indices are considered in more detail in Tables 1.5.a and 1.5.b.
The composition of the top four cryptocurrencies has remained the same since the start of 2018, but there have been some changes in the top eight (not including Tether):
- in January EOS nudged out NEM, which is now in 18th place in terms of capitalization
- in September (last week) Monero passed Cardano.
Table 1.5.b. Daily ZAK-8 Crypto index calculation (continuation of Table 1.5.а)

Table 1.6 gives a list of events, information on which appeared last week, which could impact both the prices of specific cryptocurrencies and the market in general.
Table 1.6. Events that could have an influence on cryptocurrency prices in the future

1.2. Market trends
The weekly cryptocurrency and digital asset market trends from December 31, 2017, to September 16, 2018, are presented as graphs (Fig. 1.1-1.5).
Table 1.7. Legends and descriptions of the graphs


Figure 1.1. Total cryptocurrency market capitalization
Figure 1.1 shows a graph of the weekly cryptocurrency market change from December 31, 2017, to September 16, 2018. Over this period, market capitalization dropped from $572.5 billion to $201.4 billion, i.e. by 65%. Last week (September 9-16, 2018) cryptocurrency market capitalization increased from $193.4 billion to $201.4 billion (as of September 16, 2018, based on the average daily figures from coinmarketcap.com).

Figure 1.2. Change in market capitalization
The market is susceptible to sudden and drastic fluctuations. Nine of the thirteen weeks in the first quarter of 2018 were “in the red,” i.e. capitalization fell based on the results of each of these weeks, and the weekly fluctuations ranged from USD -136 billion to USD +250 billion.
Six of the thirteen weeks in the second quarter were “in the red.” The market grew based on the results of the other seven weeks. As noted earlier, a growth was seen in April, while in May and June there was generally a reduction in capitalization. The weekly fluctuations ranged from USD -72 billion to USD +62.2 billion.
Six of the past 11 weeks of the third quarter saw an increase in capitalization, and five a decrease (with due account of average daily data of coinmarketcap.com, see Fig. 1.2). In July there was an increase of $20 billion, but August saw a decrease of $49 billion. On the whole, since early September capitalization has fallen by approximately $25 billion.


Figure 1.3. Number of cryptocurrencies and digital assets
Since December 31, 2017, the total number of cryptocurrencies and digital assets presented on coinmarketcap has increased from 1,335 to 1,960. However, when calculating cryptocurrency market capitalization only those coins and tokens on which there is information on trades (trading volume) are taken into consideration. Over the past week their number increased from 1,749 to 1,839, while average capitalization decreased to $109.5 million. In total, over the past month 111 new coins and tokens have appeared on coinmarketcap.com. However, it should be noted that a number of other coins and tokens were also excluded from the list. Among the tokens that were added to coinmarketcap.com last week, BUMO, CYCLEAN, RealTract and Abulaba showed high trading volumes.


Figures 1.4 and 1.5. Forecast of total cryptocurrency market capitalization
As early as June the European Parliament provided the results of an in-depth analysis: Virtual Currencies and the Central Bank’s Monetary Policy: Challenges Ahead), which considers the impact of cryptocurrencies on the economy.
According to the authors, the crypto industry does not threaten the security of the Central Banks and national currencies, in fact its impact had a positive effect on global transactions and virtual currencies may become the main currency in certain countries.
The Abstract provided with the document states that virtual currencies are a contemporary form of private money. Thanks to their technological properties, their global transaction networks are relatively safe, transparent, and fast. This gives them good prospects for further development.
As we noted earlier, the movement toward the standardization of regulatory documents for the cryptocurrency industry and the rules for holding ICOs within the European Union could significantly reduce the risks for all participants (on September 4 the EU legislators discussed the “Standard” for regulating ICOs and Crowdfunding).
Last week, France, as one of the most progressive countries of the European Union, adopted a law on holding ICOs. Now anyone wishing to hold an initial coin offering must first receive the approval of the Autorité des Marchés Financiers (AMF). Therefore, investors can count on “certain guarantees,” and in the opinion of the country’s Finance Minister Bruno Le Maire the legislative framework will make it possible to attract innovators from around the world.
ICO Market Analysis (September 10-16, 2018)
1. General analysis of the ICO market (by week, month)
1.1. Brief overview of ICO market trends
1. General analysis of the ICO market (by week, month)
1.1. Brief overview of ICO market trends
Table 1.1. Brief ICO market overview, key events, news for the past week (September 10-16, 2018)

Table 1.2 shows the development trends on the ICO market since the start of May 2018. Only popular and/or successfully completed ICOs (i.e. ICOs which managed to collect the minimum declared amount of funds) and/or ICOs listed on exchanges were considered.
Table 1.2. Aggregated trends and performance indicators of past (completed) ICOs1,2,3


The data for the previous period have been adjusted to account for the appearance of more complete information on past ICOs. Over the past week (September 10-16, 2018) the amount of funds collected via ICOs equaled $129.6 million. This amount consists of the results of 11 ICOs, with the largest amount of funds collected equaling $46.6 million by the Alchemy ICO. The average collected funds per ICO project equaled $11.8 million (see Tables 1.2, 1.3). A total of more than 30 ICOs were completed last week. However, not all projects indicate the amount of funds collected on their official websites (Table 1.5).
Table 1.3. Amount of funds collected and number of ICOs


Table 1.3 shows that the largest amount of funds was collected via ICOs in March 2018, mainly due to the appearance of major ICOs. The highest average collected funds per ICO was also seen in March 2018.

Figure 1.1. Trends in funds collected and number of ICOs since the start of 2017
1.2. Top ICOs since the start of the month
Table 1.4. Top 10 ICOs by the amount of funds collected (September 10-16, 2018)


The data for the previous period (September 10-16, 2018) may be adjusted as information on the amounts of collected funds by completed ICOs is finalized.
Last week’s leader was the Alchemy project, which intends to become the leading P2P (peer-to-peer) lending platform based on blockchain technology. Alchemy will build the lending market on a peer-to-peer (P2P) network using the advantages of smart contracts, artificial intelligence, and machine learning, which will ensure access to loan funds with the ability to factor in loan risk.
Figure 1.2 shows the top 10 ICOs.

Figure 1.2. Top 10 ICOs by the amount of funds collected (September 10-16, 2018)
1.3. Top ICOs in the Finance category
The list of top ICOs by category is compiled with due account of the categories of the leading ICOs for the week. The Alchemy project was not among the ten largest projects in the Finance category by the amount of funds collected via ICO (Table 1.5).
Table 1.5. Top 10 ICOs by the amount of funds collected, Finance category

The presented projects from the top 10 in the Finance category currently have low token performance indicators ranging from 0.04x to 0.49x.
The Bankera project can be considered one of the most successful ICOs by the amount of funds collected, since it collected more than $150 million. Its current token price to token sale price indicator equals 0.18х. When considering this indicator, it should be remembered that the Bankera project completed its ICO on February 28, 2018, i.e. the fall in its price by more than 5x took place against the backdrop of a major adjustment of the cryptocurrency market.

Figure 1.3. Top 10 ICOs by the amount of funds collected, Finance category
During the analyzed period (September 10-16, 2018) more than 30 ICO projects were completed, and at least 11 projects have clearly indicated the amount of funds collected on their websites and this amount exceeds $100,000. The total amount of funds collected equaled around $130 million. Last week’s leader was the Alchemy project, which collected $46.62 million. The total amount of funds collected by a number of ICOs failed to reach even $100,000 (the information for some projects is still being finalized).
The Glossary is given in the Annex.
Annex
Glossary


Hi! I am a robot. I just upvoted you! I found similar content that readers might be interested in:
https://www.coinspeaker.com/2018/09/19/weekly-cryptocurrency-market-analysis-september-9-16-2018/