Cryptocurrency and ICO Market Analysis (July 1-8, 2018)


This report presents data on cryptocurrency and ICO market changes during 2018. Special emphasis has been placed on an analysis of the changes that took place during the period July 1-8, 2018.
Information as of July 9, 2018
Professor Dmitrii Kornilov, Doctor of Economics, Member of the Russian Academy of Natural Sciences, and Leading Analyst at ICOBox
Dima Zaitsev, PhD in Economics, Head of International Public Relations and Business Analytics Department Chief at ICOBox
Nick Evdokimov , Co-Founder of ICOBox
Mike Raitsyn , Co-Founder of ICOBox
Anar Babaev , Co-Founder of ICOBox
Daria Generalova, Co-Founder of ICOBox
Cryptocurrency Market Analysis (July 1-8, 2018)
1. General cryptocurrency and digital assets market analysis. Market trends
1.1. General cryptocurrency and digital assets market analysis
1. General cryptocurrency and digital assets market analysis. Market trends
1.1. General cryptocurrency and digital assets market analysis
Table 1.1. Trends in capitalization of the cryptocurrency market and main cryptocurrencies from April 1, 2018, to July 8, 2018
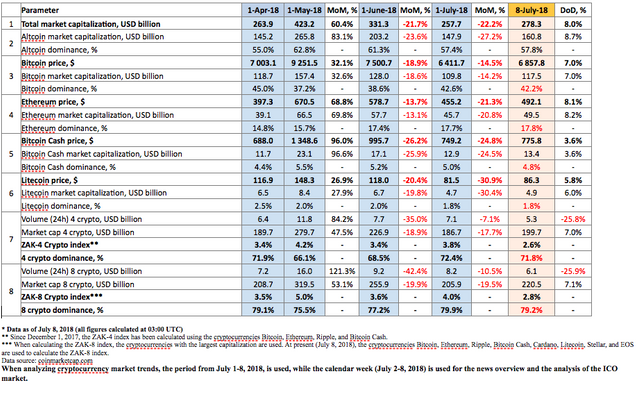
Cryptocurrency market capitalization increased over the analyzed period (July 1-8, 2018) and as of 03:00 UTC equaled $278.3 billion (see Table 1.1). The growth compared to the start of the month equaled around $20 billion.
The dominance of the four and eight largest cryptocurrencies as of 03:00 UTC on July 8, 2018, equaled 71.8% and 79.2%, respectively, with bitcoin dominance sitting at 42.2% (see Table 1.1). Last week’s growth leaders from among the top 500 cryptocurrencies by capitalization showed an increase of more than 100%: Sakura Bloom (+290%), GoChain (+148.3%), Hydrogen (+125.89%), and Metaverse ETP (+116.24%).
During the period from July 1-8, 2018, cryptocurrency market capitalization fluctuated from $252.5 billion (min) to $280.8 billion (max) (Fig. 1a), i.e. within a range of $28.3 billion. For its part, bitcoin capitalization fluctuated from $107.7 billion (min) to $117.9 billion (max), i.e. within a range of $10.2 billion.
The three vertical jumps (shown with the arrows in Fig. 1a) should be noted. These jumps resulted in an increase in capitalization by $5.3 billion (first jump), $3.4 billion (second jump), and $4.1 billion (third jump).
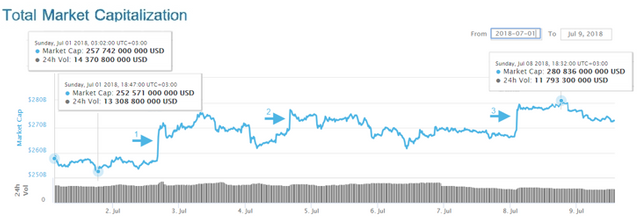
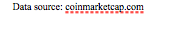
Figure 1a. Cryptocurrency market capitalization since July 1, 2018
Figure 1b shows bitcoin capitalization (red line) superimposed on cryptocurrency market capitalization (blue line). The lines are practically identical.
Figure 1b. Capitalization of the cryptocurrency market (blue) and bitcoin (red) since July 1, 2018
The main jumps in capitalization took place on July 2, 4 and 8 (see Fig. 1b).
In particular, on July 2 the oldest Chinese cryptocurrency exchange BTCC published news on the opening of its new platform. BTCC announced zero trading fees for the first three months. BTCChina was closed in September 2017 due to the bans introduced in the country on cryptocurrency trading.
On July 2 it was also published that “Coinbase Custody is Officially Open For Business.” Coinbase is the largest American cryptocurrency company, and has begun to accept funds from a wide range of institutional players in the USA and EU. It was stated that in the coming weeks Coinbase will continue onboarding world-class clients (including leading crypto hedge funds, exchanges and ICO teams), and that the company is currently responsible for the custody of more than $20 billion in cryptocurrency assets.
As reported by bitcoinist.com, Flow Traders NV, the largest exchange-traded fund (ETF) in Europe, has offered its clients the chance to buy and sell cryptocurrencies on regulated stock exchanges. It is the first company to begin working with bitcoin and Ethereum exchange-traded notes (ETN).
Therefore, the sharp jumps are associated with the activity of the major institutional players entering the cryptocurrency market.
The rise and fall of cryptocurrency prices over the past seven days (July 1-8, 2018)
During the period from July 1-8, 2018, the change in the prices of cryptocurrencies in the top 500 ranged from -51.51% (Tezos) to +290% (Sakura Bloom).
Sakura Bloom was a cryptocurrency with fairly small trading volumes, but after July 5 its 24-hour trading volumes increased to $200,000-$500,000. This cryptocurrency showed the largest price growth, which was caused by the favorable news on collaboration (https://twitter.com/sekigahara_skb/status/1015039827262169089). Tezos, on the other hand, demonstrated the worst result. Due to prior problems related to a disagreement among the development team, the price fell by more than 50% as Tezos launched its main network and trading in the cryptocurrency began on exchanges, leading to fall in price.
The price of 364 cryptocurrencies and digital assets from the top 500 showed growth, including 79 from the top 100.
Over the past week the number of cryptocurrencies with a capitalization of more than $1 billion increased from 18 to 19, with the price of all of them appreciating except Tezos (-51.51%), VeChain (-1.44%), Binance Coin (-1.17%), and Tether (the price of which is tied to the US dollar).
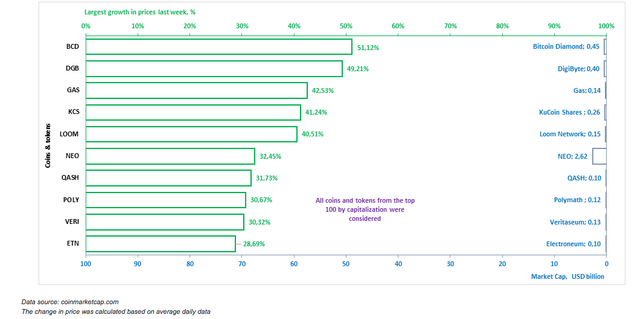
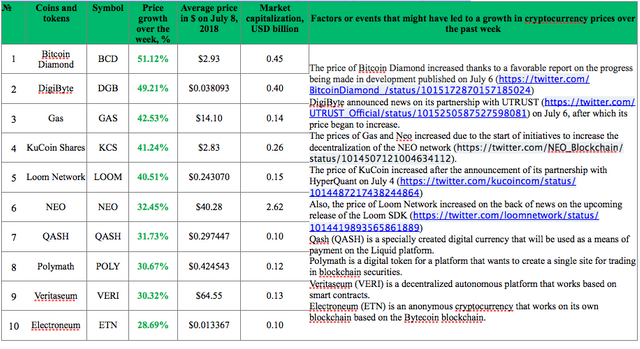
The coins and tokens from the top 100 that demonstrated the largest price growth are given in Fig. 2.
Biggest gainers and losers over the week (July 1-8, 2018)
The prices of some cryptocurrencies may fluctuate from -50% to +50% over the course of a single day. Therefore, when analyzing cryptocurrency price trends, it is advisable to use their average daily amounts on various cryptoexchanges.
Below we consider the 10 cryptocurrencies that demonstrated the most significant change in price over the past week (Fig. 2-3). In this regard, only those coins and tokens included in the top 100 (Fig. 2, Fig. 3) in terms of market capitalization were considered2.
Figure 2. Largest growth in prices over the past week
Tables 1.2 and 1.3 show the possible factors or events that might have influenced the fluctuation in prices for certain cryptocurrencies. Table 1.4 shows the possible factors or events that might have influenced the cryptocurrency market in general.
Table 1.2. Factors or events that might have led to a growth in cryptocurrency prices over the past week
A depreciation in price was seen last week for 136 coins and tokens from the top 500 cryptocurrencies and digital assets by capitalization. The ten cryptocurrencies from the top 100 that experienced the most noticeable drops in price are shown in Fig. 3 and Table 1.3.
Figure 3. Largest fall in prices over the past week
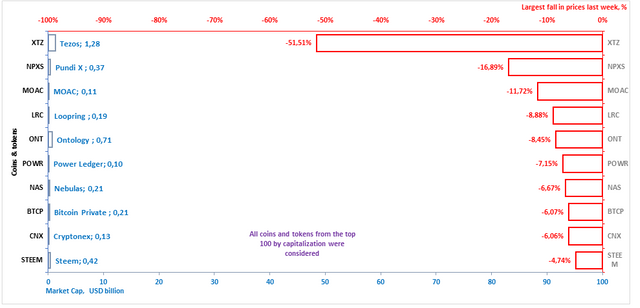
Table 1.3. Factors or events that might have led to a fall in cryptocurrency prices over the past week
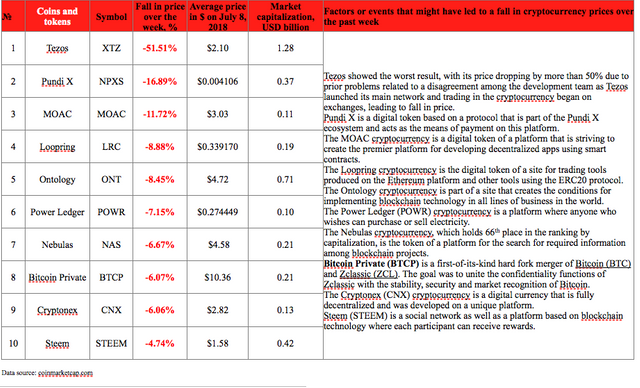

Table 1.4 shows events that took place from July 2-8, 2018, that had an impact on both the prices of the dominant cryptocurrencies and the market in general, with an indication of their nature and type of impact.
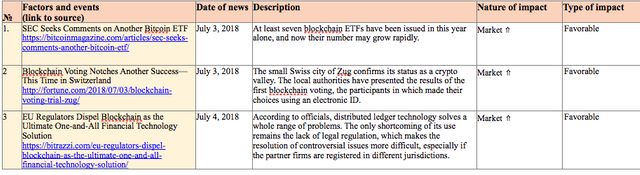
Table 1.4. Key events of the week having an influence on cryptocurrency prices, July 2-8, 2018
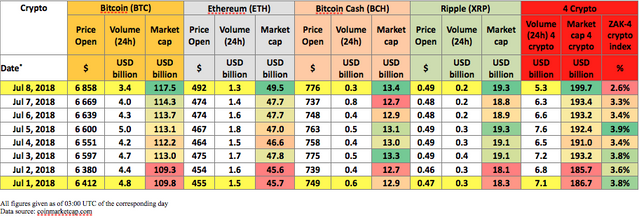
To analyze trading activity on cryptocurrency exchanges, the ZAK-n Crypto index is calculated (see the Glossary). The values of the ZAK-4 Crypto and ZAK-8 Crypto indices are presented in Tables 1.1, 1.5.a, and 1.5.b. In July the 24-hour trading volumes (Volume 24h) for the four dominant cryptocurrencies (Bitcoin, Ethereum, Bitcoin Cash, Ripple) equaled from $5.3 billion to $7.6 billion (Table 1.5.a). The value of the daily ZAK-4 Crypto ranged from 2.6% to 3.9% of capitalization. The highest trading volume was seen on July 5.
Table 1.5.a. Daily ZAK-4 Crypto index calculation (from July 1-8, 2018)
The 24-hour trading volumes (Volume 24h) for the eight dominant cryptocurrencies (Bitcoin, Ethereum, Bitcoin Cash, Ripple, Litecoin, Stellar, EOS, and Cardano) fell to $6.1 billion by the end of last week (Table 1.5.b), or 2.8% of their market capitalization. The ZAK-4 Crypto and ZAK-8 Crypto indices are considered in more detail in Tables 1.5.a and 1.5.b.
Table 1.5.b. Daily ZAK-8 Crypto index calculation (continuation of Table 1.5.а)
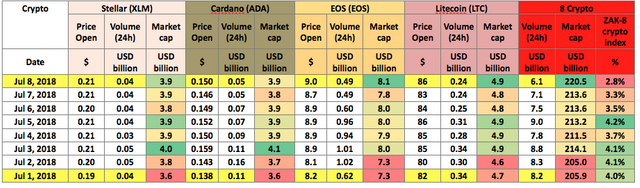
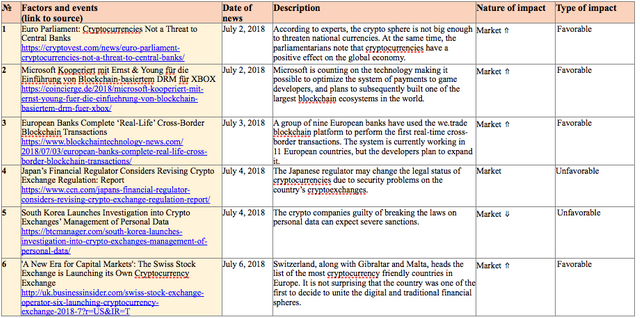
Table 1.6 gives a list of events, information on which appeared last week, which could impact both the prices of specific cryptocurrencies and the market in general.
Table 1.6. Events that could have an influence on cryptocurrency prices in the future
1.2. Market trends
The weekly cryptocurrency and digital asset market trends from December 31, 2017, to July 8, 2018, are presented as graphs (Fig. 1.1-1.5).
Table 1.7. Legends and descriptions of the graphs
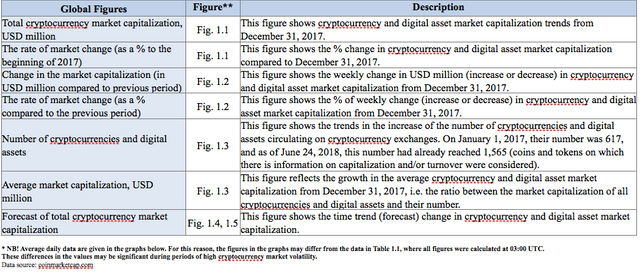
Figure 1.1. Total cryptocurrency market capitalization
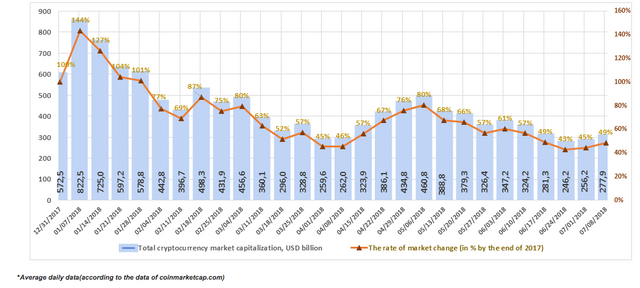
Figure 1.1 shows a graph of the weekly cryptocurrency market change from December 31, 2017, to July 8, 2018. Over this period, market capitalization dropped from $572.5 billion to $277.9 billion, i.e. by 51%. Last week (July 1-8, 2018) cryptocurrency market capitalization increased from $256.2 billion to $277.9 billion (as of July 8, 2018, based on the average daily figures from coinmarketcap.com).
Figure 1.2. Change in market capitalization
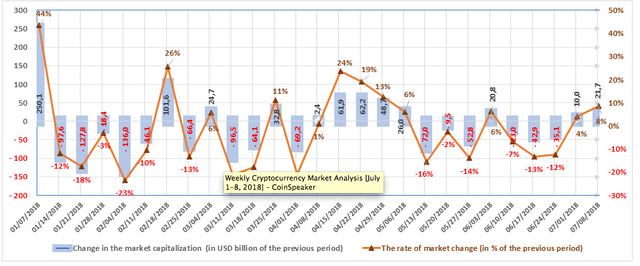
The market is susceptible to sudden and drastic fluctuations. Nine of the thirteen weeks in the first quarter of 2018 were “in the red,” i.e. capitalization fell based on the results of each of these weeks, and the weekly fluctuations ranged from USD -136 billion to USD +250 billion.
Six of the thirteen weeks in the second quarter were “in the red.” The market grew based on the results of the other seven weeks. As noted earlier, a growth was seen in April, while in May and June there was generally a reduction in capitalization. The weekly fluctuations ranged from USD -72 billion to USD +62.2 billion.
The first week of the third quarter (July 1-8, 2018) saw an increase in cryptocurrency market capitalization by approximately 8%, or $21.7 billion (with due account of average daily data, see Fig. 1.2).
Data source: coinmarketcap.com (coins and tokens on which there is information on capitalization and/or turnover were considered)
Figure 1.3. Number of cryptocurrencies and digital assets
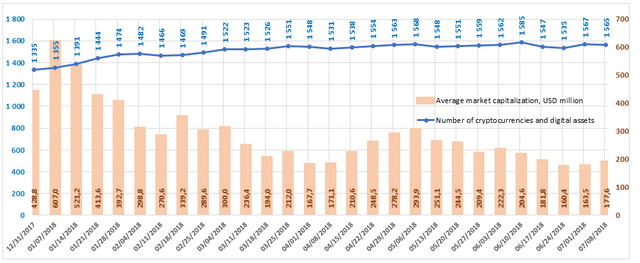

Since December 31, 2017, the total number of cryptocurrencies and digital assets considered when calculating market capitalization has increased from 1,335 to 1,565. Over the past week their number decreased from 1,567 to 1,565, but average capitalization increased to $177.6 million. In total, over the past month 48 new coins and tokens have appeared on coinmarketcap.com. However, it should be noted that a number of other coins and tokens were also excluded from the list. Among the tokens that were added to coinmarketcap.com last week, Project Pai, GoNetwork, Mainframe and Wowbit showed high trading volumes.
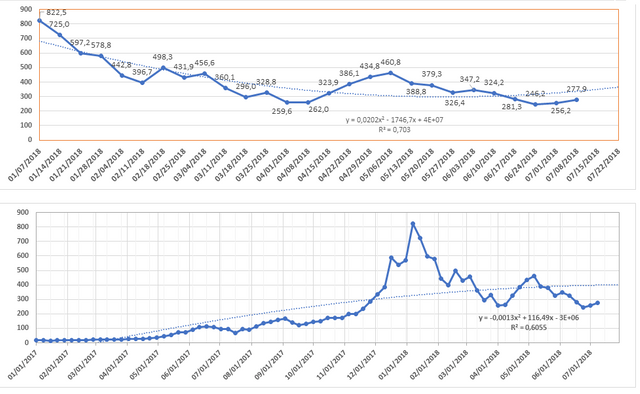
Figures 1.4 and 1.5. Forecast of total cryptocurrency market capitalization
In late June and early July there were notable changes in legal regulation of cryptocurrencies, which by and large may have a positive impact on the crypto industry.
On July 5 the Korean portal http://www.thebchain.co.kr reported that the South Korean government intends to announce a sectoral classification system for blockchain and cryptocurrencies this month, and is thereby essentially ready to recognize digital assets as industry institutions. The industry will be split into several categories. The Ministry of Science and ICT previously published a development strategy for blockchain technology in South Korea. The Korea Times also stated that the country is planning to loosen regulations of the cryptocurrency market in line with the recommendations of some member countries of the Group of 20 (G20).
Forbes reports that five countries have created a united operational alliance (the Joint Chiefs of Global Tax Enforcement, known as the J5) that will combat cryptocurrency tax and financial crimes. The alliance includes the tax enforcement authorities of the USA, Australia, Canada, Netherlands, and the United Kingdom.
According to bitcoin.com, a Japanese district court has become the first to sentence a person to a jail term in a case of remote mining of the Monero cryptocurrency.
Pursuant to the data of cointelegraph.com, Bermuda is updating its banking legislation and creating a new class of banks to service Fintech and blockchain companies. The Government of Bermuda revealed its plans to introduce amendments to the Law on Banking, since local banks have refused to provide banking services to new types of companies due to concerns over regulatory problems and potential risks.
Malta has adopted three new laws to regulate the cryptocurrency industry. On July 4 the Maltese parliament passed the Digital Innovation Authority Act, the Innovative Technological Arrangement and Services Act, and the Virtual Financial Asset Act in their third reading.
ICO Market Analysis (July 1-8, 2018)
1. General analysis of the ICO market (by week, month)
1.1. Brief overview of ICO market trends
1. General analysis of the ICO market (by week, month)
1.1. Brief overview of ICO market trends
Table 1.1. Brief ICO market overview, key events, news for the week of July 2-8, 2018
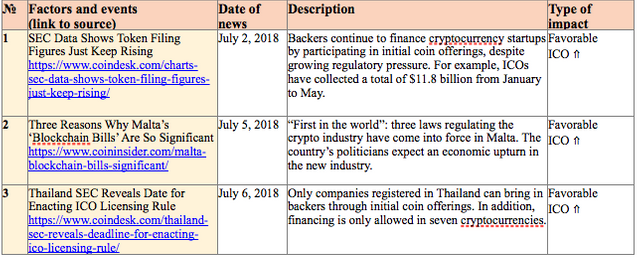
Table 1.2 shows the development trends on the ICO market since the start of the second quarter of 2018. Only popular and/or successfully completed ICOs (i.e. ICOs which managed to collect the minimum declared amount of funds) and/or ICOs listed on exchanges were considered.
Table 1.2. Aggregated trends and performance indicators of past (completed) ICOs1,2,3
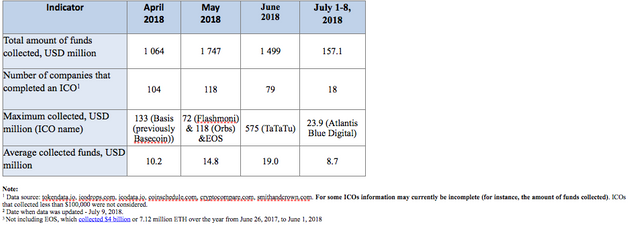
Over the previous period (July 1-8, 2018) the amount of funds collected via ICOs equaled $157.1 million. This amount consists of the results of 18 successfully completed ICOs, with the largest amount of funds collected equaling $23.9 million (Atlantis Blue Digital ICO). The average collected funds per ICO project equaled $8.7 million (see Tables 1.2, 1.3). In total, more than 50 ICOs were completed last week.
Table 1.3. Amount of funds collected and number of ICOs
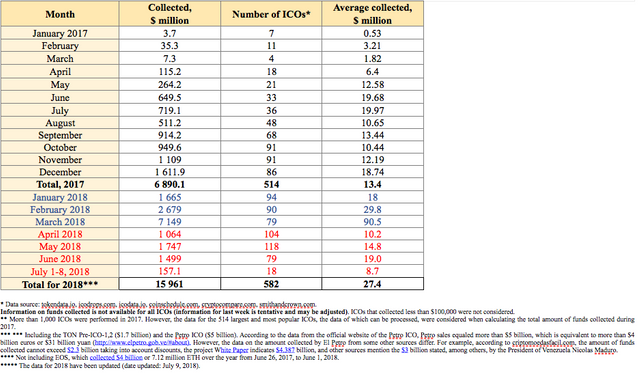
Table 1.3 shows that the largest amount of funds was collected via ICOs in March 2018, mainly due to the appearance of major ICOs. The highest average collected funds per ICO was also seen in March 2018.
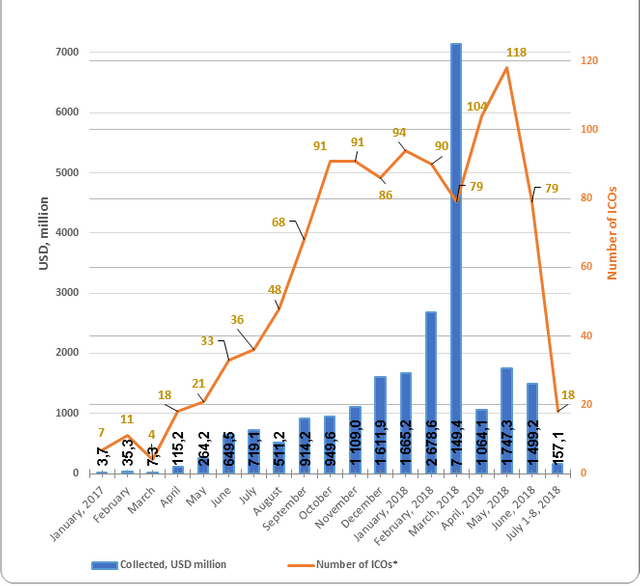
Figure 1.1. Trends in funds collected and number of ICOs since the start of 2017
1.2. Top ICOs during the analyzed period
Table 1.4 shows the ten largest ICOs
Table 1.4. Top 10 ICOs in terms of the amount of funds collected (July 1-8, 2018)
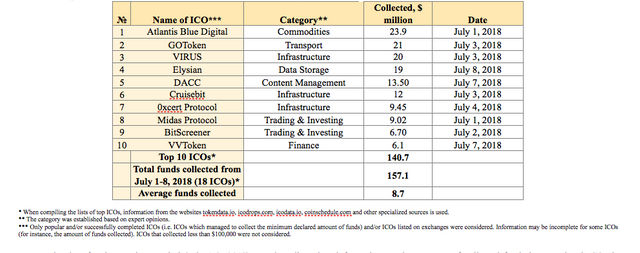
The data for the previous period (July 1-8, 2018) may be adjusted as information on the amounts of collected funds by completed ICOs is finalized.
The leader of the week (period) was the Atlantis Blue Digital project.
The Atlantis Blue Digital Token is a digital coin based on assets backed by larimar, one of the five rarest precious stones on the planet.
Larimar is a semi-precious stone found on the Barahona peninsula in the Dominican Republic. Nearly identical larimar is mined in Italy, not far from Venice. There is also information that larimar has been found in the Bahamas, as well as in northern Canada and Alaska. The Atlantis Blue project exists in the Stellar network, which has already shown good results and has a strong reputation in the crypto community. The Atlantis Blue tokens will become a new currency, which will significantly improve the entire process of mining and sale of larimar.
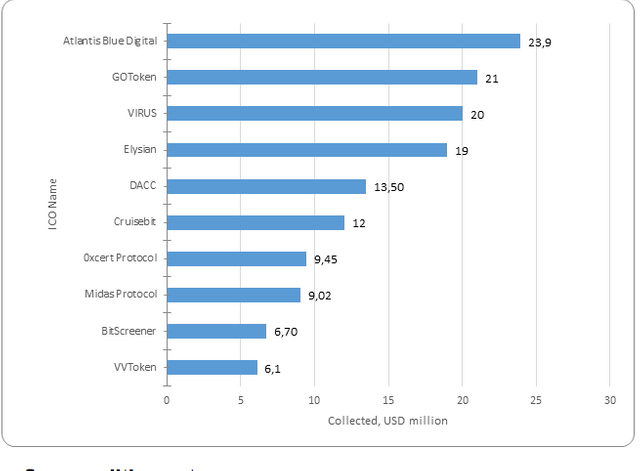
Figure 1.2 presents the ten largest ICOs completed during in early July.
Figure 1.2. Top 10 ICOs by the amount of funds collected (July 1-8, 2018)
1.3. Top ICOs in the Commodities category
The list of top ICOs by category is compiled with due account of the categories of the leading ICOs for the week. The Atlantis Blue Digital project collected the third most funds via ICO in the Commodities category (Table 1.5).
Table 1.5. Top 10 ICOs by the amount of funds collected, Commodities category
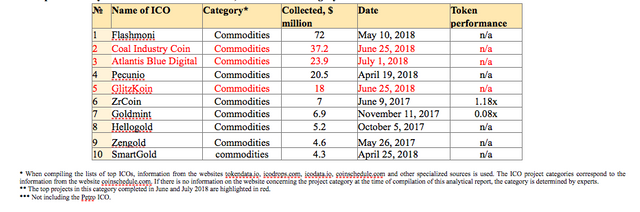
The Commodities category includes projects backed by raw commodities.
The leaders of the category were the Petro and Flashmoni projects.
Petro is a Venezuelan project backed by oil. Flashmoni is a company that offers a cryptocurrency backed by gold, innovative payment solutions, and intelligent contract advertising technology.
There is currently not enough data to compare the projects from the Commodities category based on the token performance indicator. For example, two projects from 2017 in the top 10 (ZrCoin and Goldmint) have token performance indicators of 1.18x and 0.08x. ZrCoin is an option for the industrial manufacture of synthetic zirconium dioxide, while Goldmint positions itself as a cryptocurrency backed by gold.
Figure 1.3. Top 10 ICOs by the amount of funds collected, Commodities category
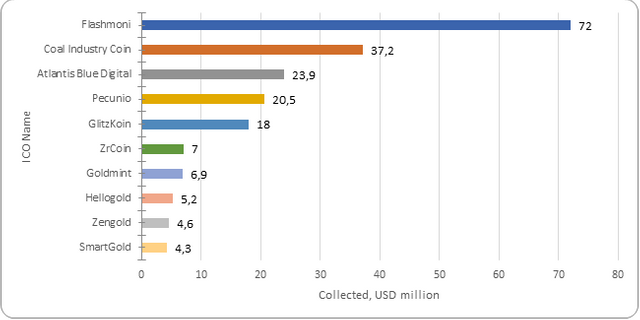
During the analyzed period (July 1-8, 2018) at least 18 ICO projects were successfully completed, each of which collected more than $100,000, with the total amount of funds collected equaling more than $157.1 million. Last week’s leader was the Atlantis Blue Digital project, which collected $23.9 million. The total amount of funds collected by a number of ICOs failed to reach even $100,000 (the information for some projects is still being finalized).
The Glossary is given in the Annex.
Annex
Glossary


