Cryptocurrency and ICO Market Analysis (August 6-12, 2018)


This report presents data on cryptocurrency and ICO market changes during 2018. Special emphasis has been placed on an analysis of the changes that have taken place during August 2018, including over the past week (August 6-12, 2018).
Information as of August 13, 2018
Professor Dmitrii Kornilov, Doctor of Economics, Member of the Russian Academy of Natural Sciences, and Leading Analyst at ICOBox
Dima Zaitsev, PhD in Economics, Head of International Public Relations and Business Analytics Department Chief at ICOBox
Nick Evdokimov , Co-Founder of ICOBox
Mike Raitsyn , Co-Founder of ICOBox
Anar Babaev , Co-Founder of ICOBox
Daria Generalova, Co-Founder of ICOBox
Cryptocurrency Market Analysis (August 6-12, 2018)
1.General cryptocurrency and digital assets market analysis. Market trends
1.1. General cryptocurrency and digital assets market analysis
1.General cryptocurrency and digital assets market analysis. Market trends
1.1. General cryptocurrency and digital assets market analysis
Table 1.1. Trends in capitalization of the cryptocurrency market and main cryptocurrencies from April 1, 2018, to August 12, 2018
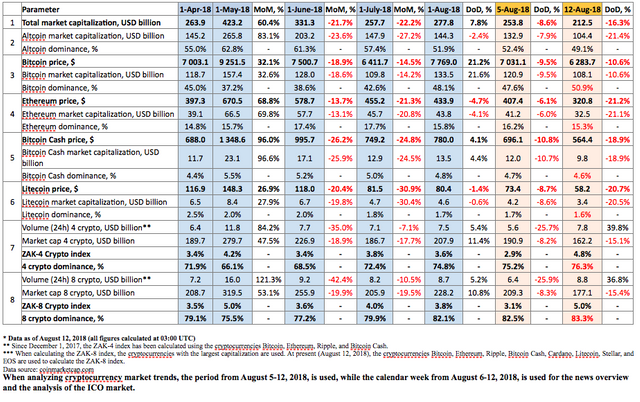
Cryptocurrency market capitalization decreased over the analyzed period (August 5-12, 2018) and as of 03:00 UTC equaled $212.5 billion (see Table 1.1). Meanwhile, bitcoin dominance exceeded 50%. The market dominance of the four and eight largest cryptocurrencies as of 03:00 UTC on August 12, 2018, equaled 76.3% and 83.3%, respectively, with bitcoin dominance rising to 50.9% (see Table 1.1).
At the beginning of December last year (December 8, 2017) the dominance of bitcoin reached 66.5% as a result of its rapid growth. In the end, its growth was a catalyst for the entire market. However, by mid-January 2018 bitcoin dominance had already fallen to 32%, which was the start of a protracted downward adjustment.
Starting in early May 2018 bitcoin dominance again began to rise, but this time against the backdrop of a falling market. All in all, bitcoin can unequivocally be called the “base asset” or “standard bearer” of the cryptocurrency market, whose price determines the direction of the movement of all other coins and tokens.
The drop in cryptocurrency market capitalization compared to the start of the month equaled around $65 billion, including a drop in bitcoin capitalization by $25 billion and altcoin capitalization by $40 billion.
During the period from August 5-12, 2018, cryptocurrency market capitalization fluctuated from $206.9 billion (min) to $260.1 billion (max) (Fig. 1a), i.e. within a range of $60 billion. For its part, bitcoin capitalization fluctuated from $105.2 billion (min) to $123.2 billion (max), i.e. within a range of $18 billion.
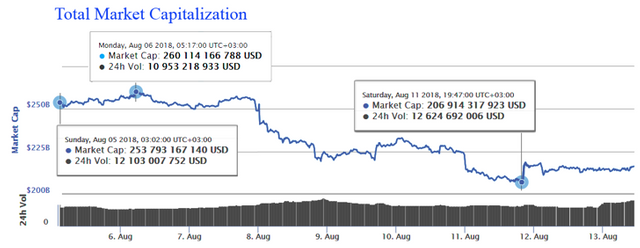
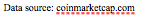
Figure 1a. Cryptocurrency market capitalization since August 5, 2018
Figure 1b shows bitcoin capitalization (red line) superimposed on cryptocurrency market capitalization (blue line). The lines are practically identical, but more intensive growth in bitcoin can be seen compared to overall market capitalization. Ultimately, over the past week bitcoin dominance increased by 3.3%, from 47.6% to 50.9% (see Table 1.1).
Figure 1b. Capitalization of the cryptocurrency market (blue) and bitcoin (red) since August 5, 2018
A clear downward trend can be seen on August 8. What could be causing the fall in capitalization?
As reported by coindesk, according to information officially published on August 7 the US Securities and Exchange Commission (SEC) delayed a decision on the VanEck-SolidX Bitcoin ETF until autumn. This information once again had an influence on cryptocurrency prices, with capitalization plunging by approximately $35 billion in one day (August 8) (Fig. 1a, 1b). We note that the SEC had previously rejected all applications on the issue of bitcoin ETFs. In response to the application of the Chicago Board Options Exchange (CBOE Global Markets), the SEC asked for comments. In our report dated July 30, we considered the impact of the previous two (1, 2) official announcements of the SEC. The first dated July 24 states that the adoption of decisions on the five applications on the issue of bitcoin ETFs submitted by Direxion had been postponed until September 21. In the second announcement dated July 26, the SEC rejected for the second time the application of the brothers Cameron and Tyler Winklevoss (Bats BZX Exchange, Inc. (“BZX”)) on the creation of a bitcoin exchange traded fund (Winklevoss Bitcoin Trust).
The rise and fall of cryptocurrency prices over the past seven days (August 5-12, 2018)
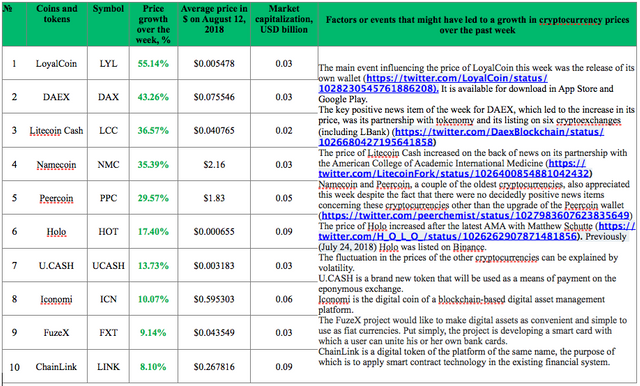
Last week’s leaders from among the top 500 cryptocurrencies by capitalization, which showed an appreciation of more than 100%, were the projects InflationCoin (+312.5%) and Global Currency Reserve (+126.1%). The growth of LoyalCoin (+55.14%), CashBet Coin (+51.37%), and MobileGo (+49.84%) should also be noted.
During the period from August 5-12, 2018, the change in the prices of cryptocurrencies in the top 500 ranged from -55% (Seele) to +312.5% (InflationCoin). The growth leader during this week was InflationCoin, the price of which appreciated by 312%. However, this price growth could be nothing more than the result of market manipulation, since the average 24-hour trading volume of this coin equals a mere $2,000. Seele experienced a large drop in price. This token has been undergoing a downward adjustment since mid-July, when the price reached its peak after a period of rapid growth.
Only 49 cryptocurrencies and digital assets from the top 500 showed growth, including 4 from the top 100 (not including Tether and TrueUSD).
Over the past week the number of cryptocurrencies with a capitalization of more than $1 billion fell from 18 to 16, with the price of all of them decreasing except Tether (its price is tied to the US dollar). The depreciation in prices equaled: IOTA (-40.74%), NEO (-29.52%), XRP (-28.9%), EOS (-27.36%), etc.
The coins and tokens from the top 200 that demonstrated the largest price growth are given in Fig. 2.
Biggest gainers and losers over the week (August 5-12, 2018)
The prices of some cryptocurrencies may fluctuate from -50% to +50% over the course of a single day. Therefore, when analyzing cryptocurrency price trends, it is advisable to use their average daily amounts on various cryptoexchanges.
Below we consider the 10 cryptocurrencies that demonstrated the most significant change in price over the past week (Fig. 2-3). In this regard, only those coins and tokens included in the top 200 (Fig. 2) and top 100 (Fig. 3) by market capitalization were considered2.
Figure 2. Largest growth in prices over the past week
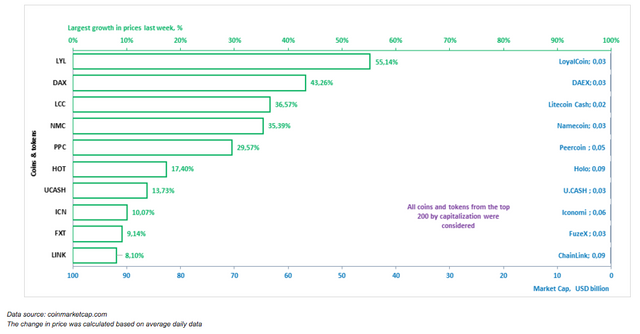
Tables 1.2 and 1.3 show the possible factors or events that might have influenced the fluctuation in prices for certain cryptocurrencies. Table 1.4 shows the possible factors or events that might have influenced the cryptocurrency market in general.
Table 1.2. Factors or events that might have led to a growth in cryptocurrency prices over the past week
A depreciation in price was seen last week for 451 coins and tokens from the top 500 cryptocurrencies and digital assets by capitalization. The ten cryptocurrencies from the top 100 that experienced the most noticeable drops in price are shown in Fig. 3 and Table 1.3.
Figure 3. Largest fall in prices over the past week
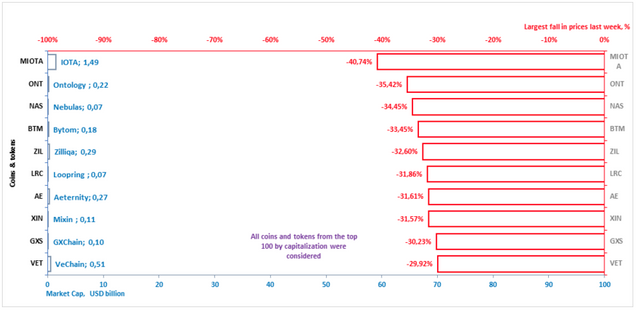
Table 1.3. Factors or events that might have led to a fall in cryptocurrency prices over the past week
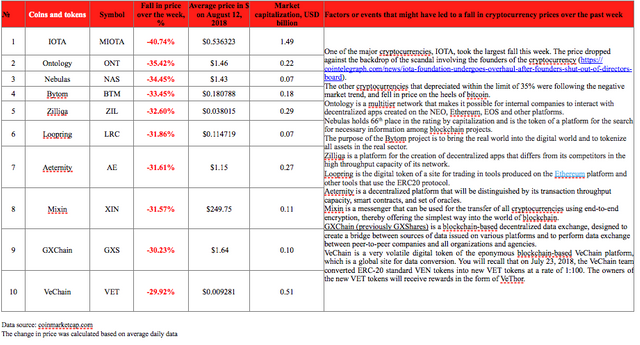
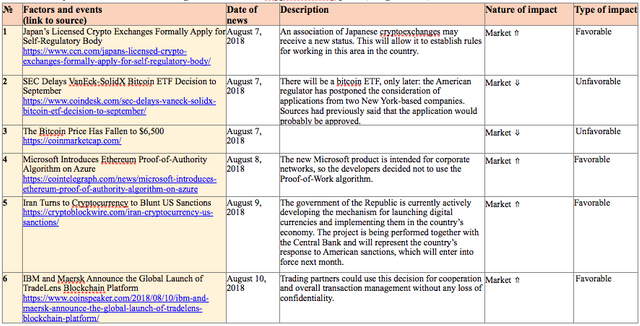
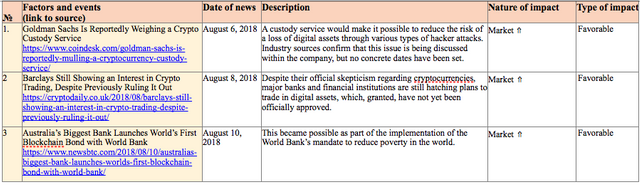
Table 1.4 shows events that took place from August 6-12, 2018, that had an impact on both the prices of the dominant cryptocurrencies and the market in general, with an indication of their nature and type of impact.
Table 1.4. Key events of the week having an influence on cryptocurrency prices, August 6-12, 2018
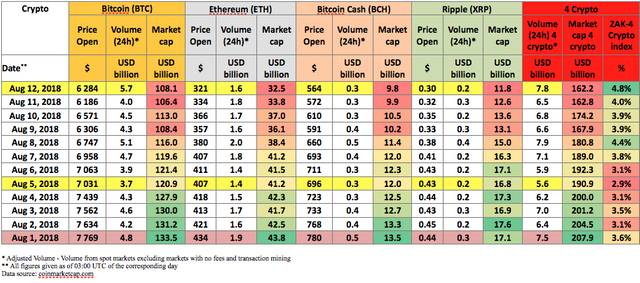
To analyze trading activity on cryptocurrency exchanges, the ZAK-n Crypto index is calculated (see the Glossary). The values of the ZAK-4 Crypto and ZAK-8 Crypto indices are presented in Tables 1.1, 1.5.a, and 1.5.b. In August the 24-hour trading volumes (Volume 24h) for the four dominant cryptocurrencies (Bitcoin, Ethereum, Bitcoin Cash, Ripple) equaled from $5.6 billion to $7.8 billion (Table 1.5.a). The value of the daily ZAK-4 Crypto ranged from 2.9% to 4.8% of capitalization. The highest trading volume was seen on August 12.
Table 1.5.a. Daily ZAK-4 Crypto index calculation (from August 1-12, 2018)
By the end of the week the 24-hour trading volumes (Volume 24h) for the eight dominant cryptocurrencies (Bitcoin, Ethereum, Bitcoin Cash, Ripple, Litecoin, Stellar, EOS, and Cardano) equaled $8.8 billion (Table 1.5.b), or 5% of their market capitalization. The ZAK-4 Crypto and ZAK-8 Crypto indices are considered in more detail in Tables 1.5.a and 1.5.b.
Table 1.5.b. Daily ZAK-8 Crypto index calculation (continuation of Table 1.5.а)
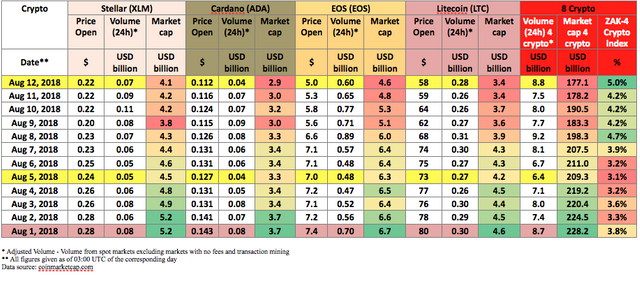
Table 1.6 gives a list of events, information on which appeared last week, which could impact both the prices of specific cryptocurrencies and the market in general.
Table 1.6. Events that could have an influence on cryptocurrency prices in the future
1.2. Market trends
The weekly cryptocurrency and digital asset market trends from December 31, 2017, to August 12, 2018, are presented as graphs (Fig. 1.1-1.5).
Table 1.7. Legends and descriptions of the graphs
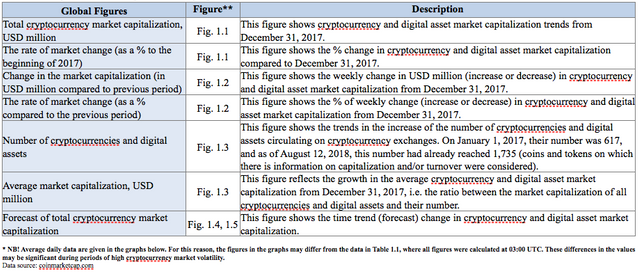
Figure 1.1. Total cryptocurrency market capitalization
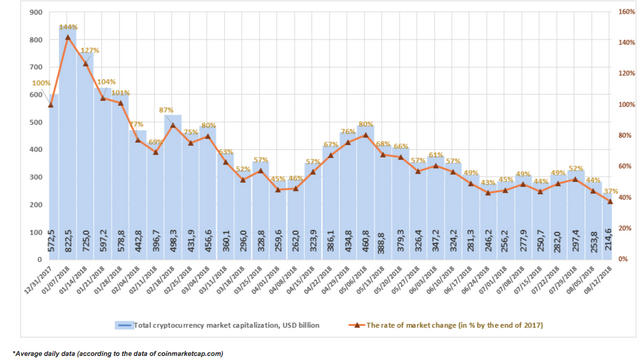
Figure 1.1 shows a graph of the weekly cryptocurrency market change from December 31, 2017, to August 12, 2018. Over this period, market capitalization dropped from $572.5 billion to $214.6 billion, i.e. by 63%. Last week (August 5-12, 2018) cryptocurrency market capitalization decreased from $253.8 billion to $214.6 billion (as of August 12, 2018, based on the average daily figures from coinmarketcap.com).
Figure 1.2. Change in market capitalization
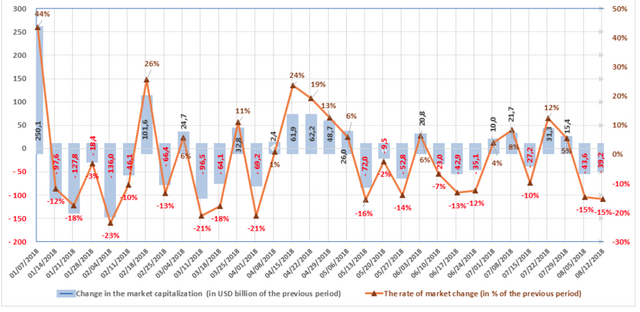
The market is susceptible to sudden and drastic fluctuations. Nine of the thirteen weeks in the first quarter of 2018 were “in the red,” i.e. capitalization fell based on the results of each of these weeks, and the weekly fluctuations ranged from USD -136 billion to USD +250 billion.
Six of the thirteen weeks in the second quarter were “in the red.” The market grew based on the results of the other seven weeks. As noted earlier, a growth was seen in April, while in May and June there was generally a reduction in capitalization. The weekly fluctuations ranged from USD -72 billion to USD +62.2 billion.
Three of the past six weeks of the third quarter saw an increase in capitalization (with due account of average daily data of coinmarketcap.com, see Fig. 1.2). In the whole, since early July capitalization has fallen by $45 billion.
Figure 1.3. Number of cryptocurrencies and digital assets
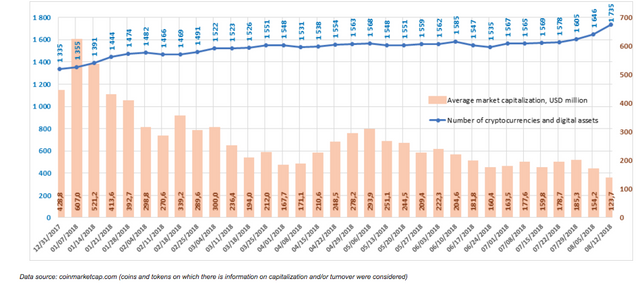
Since December 31, 2017, the total number of cryptocurrencies and digital assets presented on coinmarketcap has increased from 1,335 to 1,818. However, when calculating cryptocurrency market capitalization only those coins and tokens on which there is information on trades (trading volume) are taken into consideration. Over the past week their number increased from 1,645 to 1,735, while average capitalization decreased to $123.7 million. In total, over the past month 210 new coins and tokens have appeared on coinmarketcap.com. However, it should be noted that a number of other coins and tokens were also excluded from the list. Among the tokens that were added to coinmarketcap.com last week, Pundi X NEM, HYCON, GSENetwork, Insight Chain, ProximaX, Thingschain, and Social Lending Token showed high trading volumes.
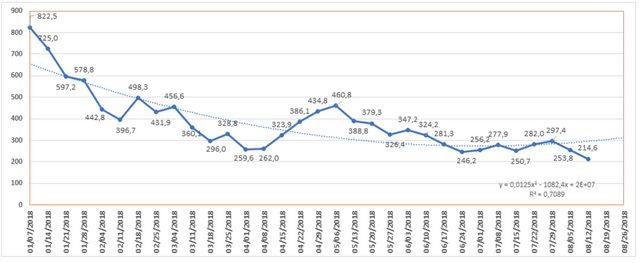
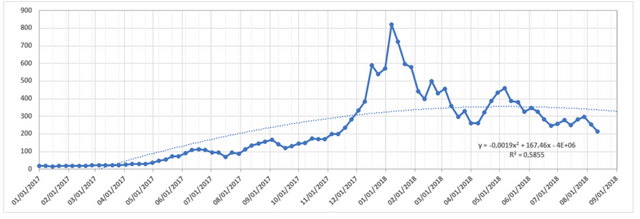
Figures 1.4 and 1.5. Forecast of total cryptocurrency market capitalization
One of the world’s largest financial corporations, the Intercontinental Exchange (ICE), has created Bakkt, a global platform for trading in digital assets. In November 2018, this platform plans to launch a one-day physically delivered bitcoin future (provided that it is reviewed and approved by the US Commodity Futures Trading Commission (CFTC)), after the maturity of which the backer will receive the underlying asset (bitcoin) and not a monetary equivalent (As an initial component of the Bakkt offering, Intercontinental Exchange’s U.S.-based futures exchange and clearing house plan to launch a 1-day physically delivered Bitcoin contract along with physical warehousing in November 2018, subject to CFTC review and approval). The platform also plans to create a guarantee fund and other services for users and institutional backers. According to the director of the Pantera Capital cryptocurrency hedge fund, Dan Morehead, the news concerning the delay by the US Securities and Exchange Commission (SEC) of a decision on bitcoin ETFs is not so important, but the development of the Bakkt platform by Intercontinental Exchange, Microsoft and Starbucks is important news. “This is really important news. It will have a huge impact on market development for the next 5-10 years. I am convinced that people should be focusing more on this news,” announced Morehead.
Due to growing demand from clients, another Swiss bank, Maerki Baumann, will begin to work with cryptocurrencies.
On August 9 the CEO of Binance, Zhao Changpeng, presented the first version (pre-α) of the Binance Decentralized Exchange (DEX), as well as the process of creation, listing and trading in tokens.
Overall, despite the drop in cryptocurrency market capitalization, trading volumes increased over the past week. As we mentioned in our previous report, this is due to the increasing popularity of fee mining. The trans-fee model (or trade-to-mine, trans-fee mining) proposes the issue of tokens to traders by exchanges as a reward for trading. In particular, on August 13 the 24-hour trading volumes without adjustment (Reported Volume) of the three leading cryptocurrency exchanges (BitForex, BitMEX, and Iquant) equaled around $10 billion. The 24-hour trading volumes with adjustment (Adjusted Volume) of the three leaders (Binance, OKEx, and Huobi) equaled only around $2.5 billion, according to the data of coinmarketcap.
ICO Market Analysis (August 6-12, 2018)
1. General analysis of the ICO market (by week, month)
1.1. Brief overview of ICO market trends
1. General analysis of the ICO market (by week, month)
1.1. Brief overview of ICO market trends
Table 1.1. Brief ICO market overview, key events, news for the past week (August 6-12, 2018)
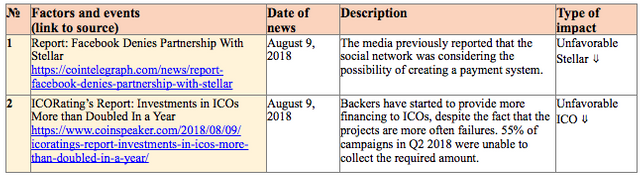
Table 1.2 shows the development trends on the ICO market since the start of the second quarter of 2018. Only popular and/or successfully completed ICOs (i.e. ICOs which managed to collect the minimum declared amount of funds) and/or ICOs listed on exchanges were considered.
Table 1.2. Aggregated trends and performance indicators of past (completed) ICOs1,2,3
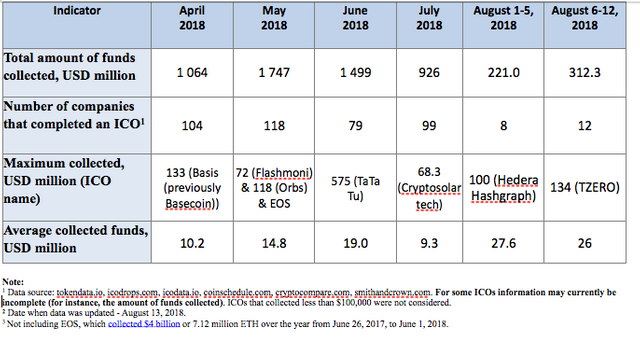
The data for the previous period have been adjusted to account for the appearance of more complete information on past ICOs. Over the past week (August 6-12, 2018) the amount of funds collected via ICOs equaled $312.3 million. This amount consists of the results of 12 completed ICOs, with the largest amount of funds collected equaling $134 million (TZERO ICO). The average collected funds per ICO project equaled $26 million (see Tables 1.2, 1.3). A total of approximately 25 ICOs were completed last week. However, not all projects indicate the amount of funds collected on their official websites.
Table 1.3. Amount of funds collected and number of ICOs
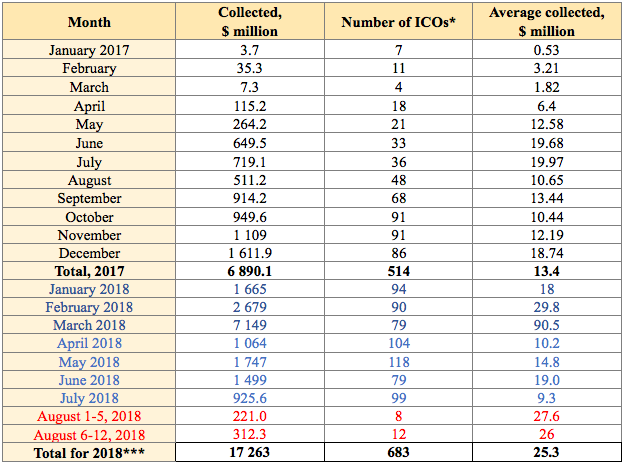
Table 1.3 shows that the largest amount of funds was collected via ICOs in March 2018, mainly due to the appearance of major ICOs. The highest average collected funds per ICO was also seen in March 2018.
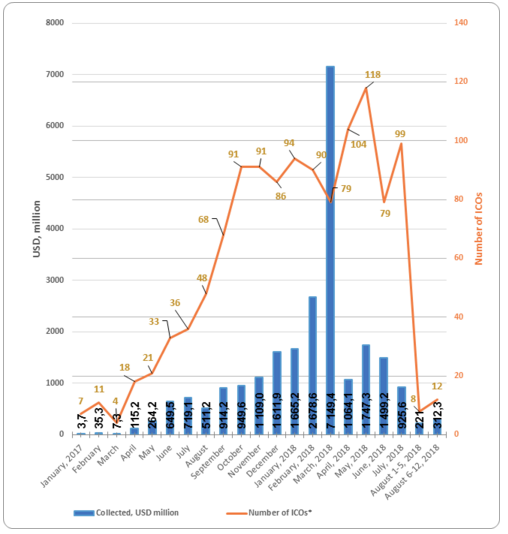
Figure 1.1. Trends in funds collected and number of ICOs since the start of 2017
1.2. Top ICOs during the analyzed period
Table 1.4 shows the ten largest ICOs
Table 1.4. Top 10 ICOs by the amount of funds collected (August 6-12, 2018)
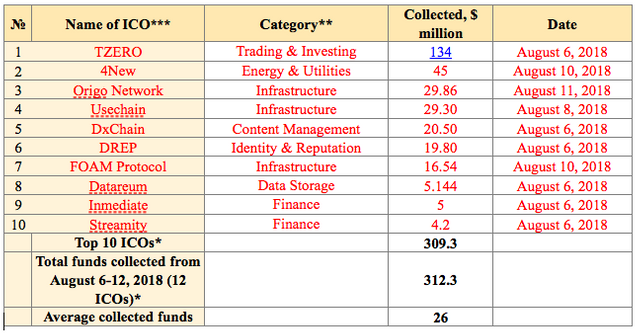

The data for the previous period (August 6-12, 2018) may be adjusted as information on the amounts of collected funds by completed ICOs is finalized.
Last week’s leader was the TZERO project. According to a publication in Forbes dated August 9, the TZERO project, a subsidiary of Blockstain Overstock.com, collected $134 million. The project began on December 18, 2017, and was developed in accordance with SEC requirements. TZERO is the first alternative trading system for cryptographic tokens that the US Securities and Exchange Commission (SEC) assigns to the category of securities. The goal of fund collection was set at $250 million. However, according to the press release the TZERO project collected $134 million, with GSR Capital to purchase a share in TZERO worth $270 million when the company’s capitalization reaches $1.5 billion.
Pursuant to project data: “TZERO’s DLR software has been designed to make securities lending activities of our licensees compliant, more transparent, and more efficient from both a cost and operational perspective. This can help existing market participants improve their workflow while allowing new types of customers to participate.”
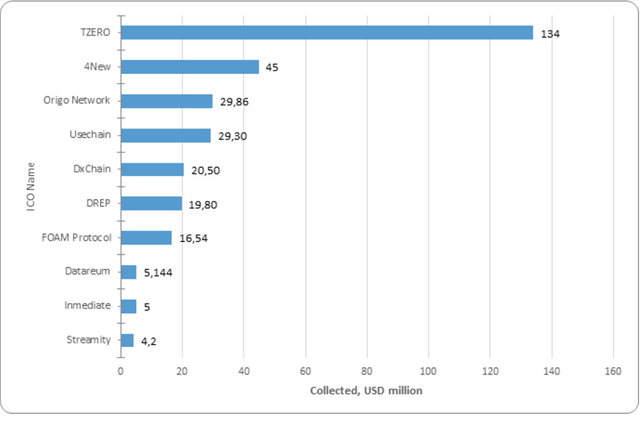
Figure 1.2 presents the ten largest ICOs completed in early August.
Figure 1.2. Top 10 ICOs by the amount of funds collected (August 6-12, 2018)
1.3. Top ICOs in the Trading & Investing category
The list of top ICOs by category is compiled with due account of the categories of the leading ICOs for the week. The TZERO project was among the top 10 largest projects by the amount of funds collected via ICO in the Trading & Investing category (Table 1.5).
Table 1.5. Top 10 ICOs by the amount of funds collected, Trading & Investing category
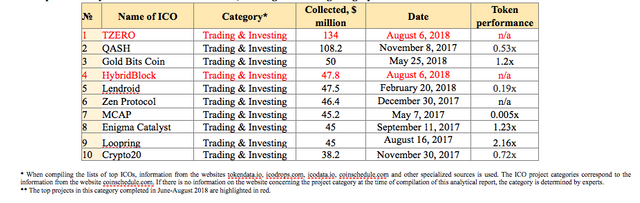
The leader of the week, the TZERO project, became the leader in the Trading & Investing category.
At present, all projects from the top 10 in this category have a token performance indicator of 0.005x to 2.16x. The most successful exchange listing among the ten presented is the Loopring project, as it has a current token price to token sale price ratio of 2.16x. When considering this indicator, it is important to remember that the Loopring ICO was completed on August 16, 2017, i.e. the 2.16x growth took place over approximately twelve months. Loopring’s current market capitalization exceeds $74 million. The MCAP project has the lowest token performance indicator. Its current market capitalization is estimated at around $215,000.
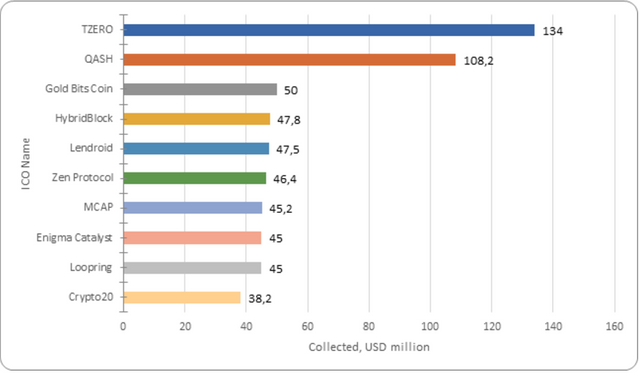
Figure 1.3. Top 10 ICOs by the amount of funds collected, Trading & Investing category
During the analyzed period (August 6-12, 2018) at least 12 ICO projects were successfully completed, each of which collected more than $100,000, with the total amount of funds collected equaling more than $310 million. Last week’s leader was the TZERO project, which collected $134 million. The total amount of funds collected by a number of ICOs failed to reach even $100,000 (the information for some projects is still being finalized).
The Glossary is given in the Annex.
Annex
Glossary


