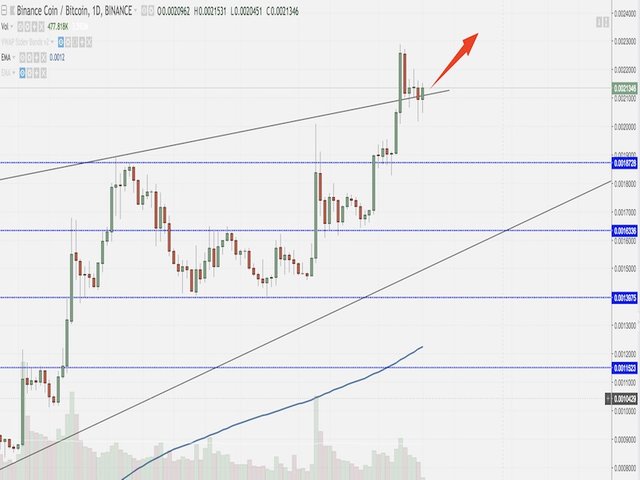
Binance coin: graph analysis
Binance (BNB) on the day of 10 June opened in the area 0.002135 BTC (on relative highs of the day), projecting the price towards the relative minima in the area 0.0020162 BTC and close at 0.002096. The resistance to keep under observation is: 0.0022875 (monthly resistance), while for the supports: 0.001872 and 0.0016336 BTC (monthly supports). The moving averages at 100 and 200 periods at the moment are oriented upwards and are respectively in area 0.0016 and 0.0012 BTC.
For those wishing to buy Binance
For those not already involved, enter the retracement confirmed in area 0.0022 BTC, with stop loss at 0.0020 and take profit in zone 0.0023 BTC.
For those who currently hold Binance
Maintain the position since the price is bouncing on the dynamic resistance of the ascending channel.
For those wishing to sell Binance
Possible bearish inputs at the time the price breaks zone 0.0020 BTC, with stop loss positioned at 0.0022 and first target in area 0.001872 BTC.
Target
Bearish
0.0014: not reached
0.0011523: not reached
Bullish
0.001633: reached April 24, 2018
0.001872: reached May 18, 2018
0.0020: reached 5 June 2018
0.0023: not reached