April Showers Bring Bitcoin (BTC) Flowers? A Case Study
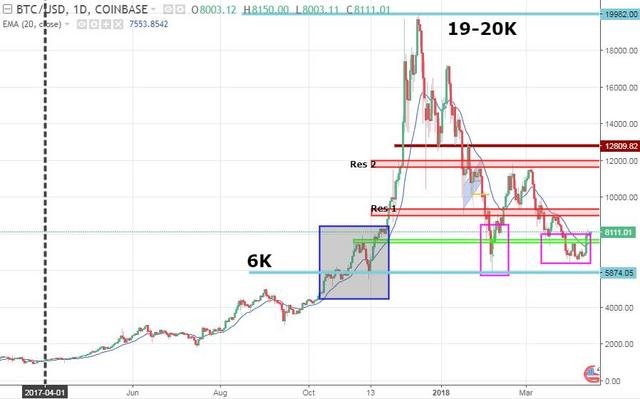
Bitcoin’s price appreciated approximately 40% between January 1st, 2014 and March 31st, 2017 (a period of more than 3 years) before exploding in the spring of 2017. Since spiking exponentially in December 2017, BTC prices have plunged as much as 70%. In these instances, it's critical to account for the broader price action context when completing an analysis.
Prices were due for a correction
Link to image
BTC is still up over 600% from its trading price at the beginning of April 2017 despite the shaky start to 2018. When BTC was trading above $19,000 in December 2017, it was up over 1,600% from its April 1st closing price – a 1,600% gain in 8-9 months! Compare that to the 40% gain noted previously between January 2014 and March 2017. Although cryptocurrencies may potentially have an enormous impact on social and economic dynamics, one could certainly argue that the prices were overextended and due for a pullback towards the end of 2017 based on historical price appreciation.
Price has now declined over 50% since making an all-time high in December. For those who are aware of cryptocurrencies and don't believe "Bitcoin is worthless", it seems fair to ask: is the bottom near?
October/November 2017: the last time prices were here...
Prior to February of this year, BTC was last trading near its current price levels (~8,100 at the time of writing) between October and November 2017.
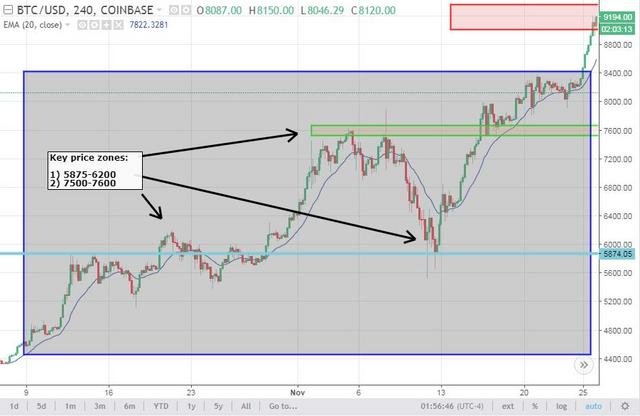
This time period, highlighted in the dark blue box in the daily chart from the first section, is illustrated below - this time zoomed-in on a 4-hour timeframe.
Link to image
BTC clearly respected the price zones between 5,875-6,200 (near the powder blue line) and 7,500-7,600 (green zone) back in October and November – as evidenced by these levels forming resistance which turned into support upon the levels being breached.
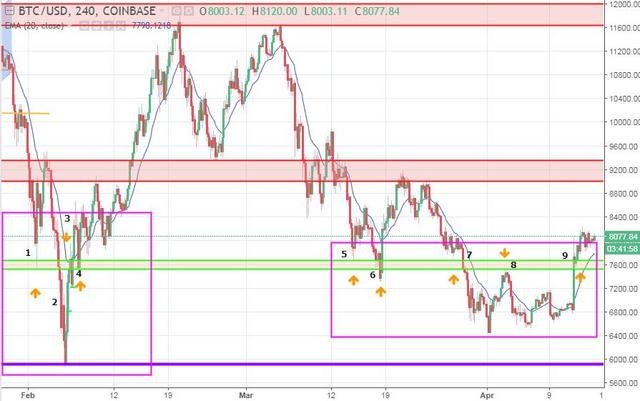
Fast forward to 2018…
Referring back to the daily chart from the first section again - after breaking through and re-testing the green zone in November, prices made an exponential move higher and didn’t return to this level again until early February 2018.
- Back in February (pink box on left below), prices broke through the green zone on impulsive selling. However, BTC eventually regained the key level on impulsive buying before moving higher to test 11,600.
- Prices proceeded to decline throughout March and again tested buyers at the green zone. Like in February, the sellers won and pushed the price lower through the key level. However, AGAIN prices have climbed back above the green zone - just like in February - creating the potential for another false break and subsequent move higher.
Link to image
The reference points listed below are mapped out on the chart above. Notice how price reacted to the green zone starting in February (pink box to the left) and continuing into March and April (pink box on right).
| February | March/April |
|---|---|
| 1) Price tested and bounced off the green zone | 5) Price bounced off the green zone |
| 2) Price then impulsive sold through the green zone | 6) Price bounced off the green zone for a second time in the same week |
| 3) Price recovered above the green zone with impulsive buying | 7) Price impulsive sold through the green zone |
| 4) Price re-tested the green zone and found support before climbing to the 11,600 region | 8) Price recovered to the green zone and tested it before selling off. Price could not build downside momentum, however and consolidated |
| " | 9) Price recovered above the green zone due to impulsive buying |
TLDR: 7,500-7,600 is a key price zone based on BTC's price action context dating back to November 2017.
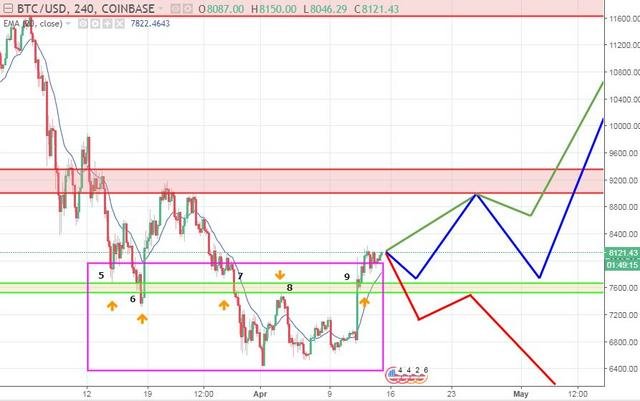
What does this mean for BTC over the short-term (next 30 days)?
Here’s a depiction of how price may react to the green zone over the short term:
Link to image
- Scenario 1 (green): price is forming a wedge (easier to see on a 1-hour timeframe) and will breakout higher (potentially on the path to 9,200 or even 11,600)
- Scenario 2 (blue): price will re-test the green zone (could be several times) around 7,500 before moving higher
- Scenario 3 (red): price will impulsively sell through the green zone (possibly re-testing it) before moving lower to test the other key price zone noted previously (remember the powder blue line) around 6,000
Final thoughts
If price can remain above the green zone, a move higher (either scenario 1 or 2), potentially targeting the 9,200 and 11,600 areas, is possible. Back in February, price moved significantly higher after a false break of the green zone. If the break below the green zone in late March/early April also proves to be a false break, this could be a great point to get in. However, a breach of the green zone would be a blow to the bulls and would suggest a potential retest of 5,875-6,200.
NOTE: The images and data presented in this article were pulled from TradingView via CoinBase unless otherwise noted.
Legal Disclaimer: This blog post only represents my opinion. I am not a financial advisor and the content of this article is not presented as financial advice. Use the provided information and opinions at your own risk. This post, along with any other post on this blog, should be used for the purposes of information, education or entertainment. It should not be considered financial or investment advice of any kind. Although the information provided is accurate and true to the best of my knowledge, there may be omissions, errors or mistakes
This was my first cryptocurrency post. If you managed to make your way through it all and have any constructive comments or suggestions, I’d greatly appreciate if you would pass them along as I’m always trying to learn and improve. Thank you for your time!
Hi, I just followed you :-)
Follow back and we can help each other succeed! @jeffgodric