Bitcoin (BTC) Price Analysis July 29th, 2019

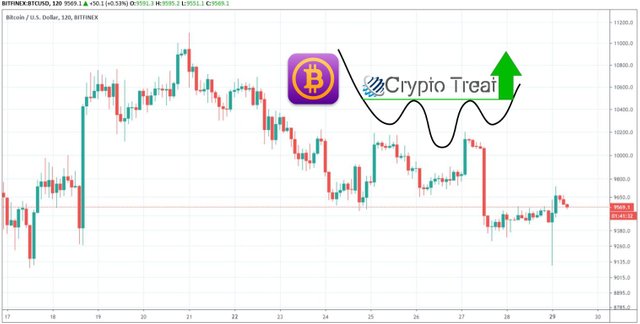
On July 17, 2019, the Bitcoin price reached a low of $9084. An upward move ensued. On July 21, the BTC price briefly reached highs above $11,000. Since then, it has been slowly decreasing. On July 29, it again reached lows close to $9000.
Will it decrease below $9000 or is there another upward move in-store? Continue reading below in order to find out.
Bitcoin Price: Trends and Highlights for July 29
- BTC/USD is trading inside a descending channel.
- There is support between $9100-$9200.
- Weekly and daily moving averages are bearish.
- There is short-term bullish divergence developing in the RSI.
Weekly BTC Price Outlook
A look at the weekly chart shows that that BTC has just finished creating a bearish candle.Since reaching a high of $13,768 in the week of June 24 – July 1, BTC has been alternating between weekly bullish and bearish candlesticks.
The bullish candlesticks have been weaker and have been followed by bearish engulfing ones.
However, we can see that for the past two weeks, the Bitcoin price has created a support level around $9200.
A closing price below it would likely initiate a rapid decrease.
Likewise, a look at the moving averages (MA) provides a bearish outlook.
The BTC price has finally fallen below the 10-week MA.
The last time this happened was before a bullish cross occurred, on March 25.
This is a sign that BTC might be falling into a long-term downtrend.
A bearish cross between the weekly MAs would confirm this theory.
Bitcoin Price in a Descending Channel
A look at the daily chart reveals that since June 24, BTC has been trading inside the descending channel outlined below.
At the time of writing, it was trading very close to the support line.
Additionally, we can see a support area that has been created between $9100-$9200.
BTC reached it on June 17 and 27.
Both times, upward moves ensued, creating long lower wicks.
This indicates that there is buying pressure in the market.
During the upward move on July 17, BTC failed to increase above the prior bearish candlesticks opening price.
If the Bitcoin price were to act in a similar manner, it would increase towards $9800, before resuming its downward movement.
This possibility is also supported by the daily moving averages.
A bearish cross transpired on July 15.
Since then, the BTC price has been trading below both MAs, facing very close resistance from the 10-day MA, which is currently near $10,000.
Short-Term
A look at the short-term also gives support to our theory.

Bullish divergence has been developing in the RSI since July 24.
Since the Bitcoin price is not following any short-term trading patterns, this divergence alone would not be enough to confidently predict a reversal.
However, combined with our previous analysis, it makes it very likely that the price will increase towards $9800.
Summary
The BTC price is trading inside a descending channel.
It reached a very significant area.
According to our analysis, it is likely to increase towards the high $9000s.
Do you think BTC will begin an upward move? Let us know in the comments below.
Disclaimer: This article is not trading advice and should not be construed as such. Always consult a trained financial professional before investing in cryptocurrencies, as the market is particularly volatile.
Images are courtesy of TradingView.
Posted from Cryptotreat Cryptotreat : https://cryptotreat.com/bitcoin-btc-price-analysis-july-29th-2019/


Warning! This user is on our black list, likely as a known plagiarist, spammer or ID thief. Please be cautious with this post!
If you believe this is an error, please chat with us in the #appeals channel in our discord.