Ripple Price Analysis: XRP Remains Above 200-days EMA But Will Bears Break Beneath?
- XRP saw a sharp 17% price drop over the past week, making it the weakest performing top-3 cryptocurrency.
- Although the momentum has slipped into bearish favor, the bulls battle to remain above the 200-days EMA.
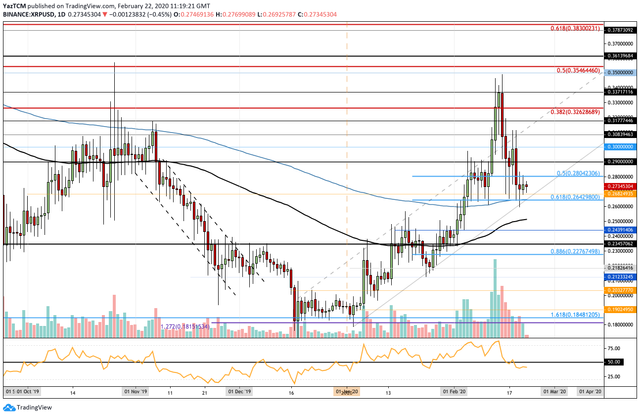
XRP dropped by a steep 17.6% over the past week, bringing the price for the cryptocurrency down to $0.273. It had rolled over at resistance at around $0.337 and started to decline. We were hoping the support at $0.28 (.5 Fib Retracement) would hold, however, it has since dropped further lower.
XRP remains ranked as the 3rd-largest cryptocurrency with a total market cap value of around $12.00 billion.
XRP Price Analysis
Market Overview
Since our last analysis, XRP dropped beneath the support at the .5 Fib Retracement level and continued further lower. We can see that it is finding support at $0.268 as the bulls manage to keep the market above the 200-day EMA.
Short term prediction: NEUTRAL
XRP remains neutral but is in danger of turning bearish if it was to fall beneath the support at $0.24. It would need to climb above $0.3 to turn bullish again.
If the sellers push beneath the support at $0.268, the first level of additional support is expected at $).264. This is provided by the .618 Fib retracement and further bolstered by the 200-days EMA and therefore is considered as pretty strong.
Beneath this, support lies at $0.26, $0.25 (100-days EMA) and $0.243.
On the other hand, resistance is expected at $0.28, $0.29, and $0.30. If they can break $0.30 the market would be considered as bullish again. Above this, resistance lies at $0.308, $0.3177 and $0.3262.
The RSI has indeed slipped beneath the 50 level to show that the sellers have taken charge of the market momentum right now.
Key Levels:
Support: $0.268, $0.264, $0.26, $0.25, $0.243.
Resistance: $0.28, $0.29, $0.30, $0.308, $0.3177, $0.326, $0.377.
Image from TradingView
Follow CoinGape on social media handles and stay updated!
Telegram | Twitter | Medium

