WEEKLY REVIEW OF THE TOP 5 CRYPTOCURRENCIES 28th May 2019
The rally in Bitcoin is attracting a large number of investors. Coinmetrics.io co-founder Nic Carter, recently tweeted that the number of addresses holding at least 0.1 BTC has made a new all-time high. This shows a surge in demand that will be bullish for the leading cryptocurrency in the long-term.
While in dollar terms, Bitcoin is still well below its lifetime highs, it has hit a new high against the Argentine peso. The Latin American nation is facing hyper-inflation that has devalued its currency to such an extent that people who bought Bitcoin even at the top in end-2017 are sitting on profits. This shows how Bitcoin acts as a store of value.
However, even with all the bullish signals, we believe that the rally is likely to hit a wall soon. It is unlikely to skyrocket towards the highs without witnessing sharp corrections in between. Therefore, instead of chasing the price higher, we suggest traders wait for the sharp pullbacks to buy.
The upcoming halvening in Bitcoin is also attracting long-term investors. Previous two instances of halvening in Bitcoin had resulted in strong rallies and some investors expect a repeat this time again. Additionally, the buzz around the launch of Facebook’s own cryptocurrency is also cheering the markets. After all, with its huge client base, Facebook can singlehandedly boost the use and interest in cryptocurrencies. While the fundamental developments are positive, what does the technical picture project? Let’s find out.
LEARN HOW TO TRADE CRYPTOCURRENCY WITH A MASTER CRYPTO TRADER!
BTC/USD
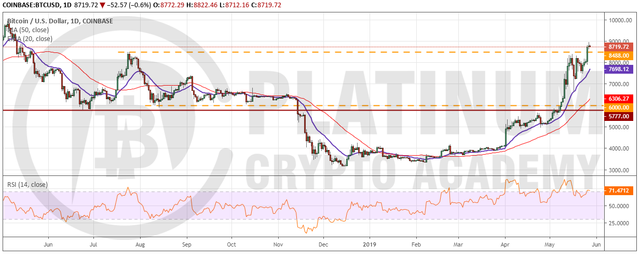
Bitcoin extended its up move on May 26 and broke out of the overhead resistance at $8,488. The bulls have managed to sustain the price above the breakout level for the past two days, which is a bullish sign. With both the moving averages trending up and the RSI in the overbought zone, the path of least resistance is to the upside. The next target to watch on the upside is $10,000, which is likely to act as a stiff resistance.
The pace of the current rally is unsustainable. We anticipate a stiff resistance in the $8,488-$10,000 zones. If the price slips below $8,488, it will signal a lack of demand at higher levels. However, the trend will weaken only after the digital currency breaks down of the 20-day EMA because the bears have not managed two consecutive closes (UTC time) below the 20-day EMA since breaking out of it on Feb. 08
ETH/USD
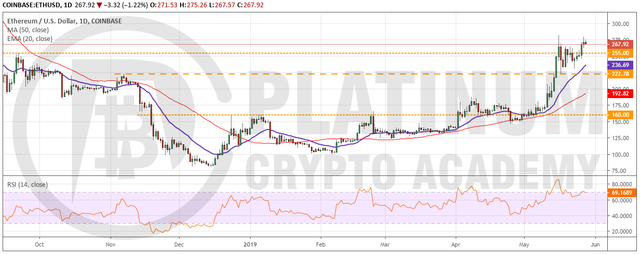
The bulls pushed Ethereum above the overhead resistance of $255 on May 26. They are now attempting to scale above $281.77. Both the moving averages are sloping up and the RSI is in the overbought zone, which shows that the bulls are in charge.
The next stop is the $300-$322 resistance zone. We anticipate the bears to defend this zone with strength. Therefore, traders who are left with 50% of their long positions based on our earlier recommendation can book complete profits above $300. Until then, the stops can be raised to $245.
Our bullish view will be invalidated if the cryptocurrency turns around from the current levels and dives below $255. That will indicate profit booking at higher levels. A breakdown of the 20-day EMA will signal a deeper correction.
XRP/USD
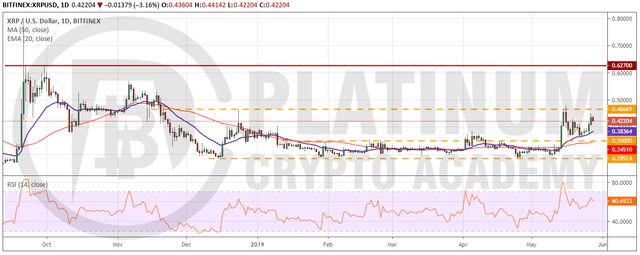
XRP has bounced off the 20-day EMA, which is a positive sign. It will now attempt to climb above the overhead resistance of $0.46669. The 20-day EMA is sloping up and the RSI is in the positive territory. This suggests that the bulls are at an advantage in the short-term. A breakout of the overhead resistance can propel the price to $0.6270.
Our bullish view will be negated if the bulls fail to breakout of $0.46669. In such a case, a drop to the 20-day EMA is probable. If this support also fails to hold, the cryptocurrency can correct to $0.35. Traders who are long on our earlier recommendation can trail the stop loss higher to $0.34. Let’s reduce our risk.
BCH/USD
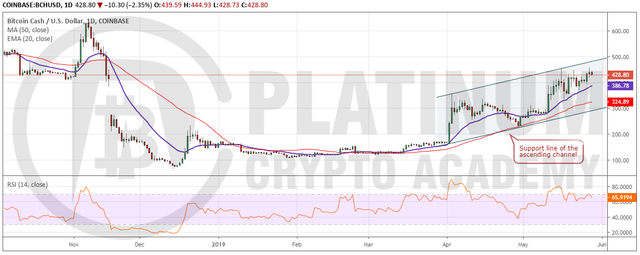
Bitcoin cash is trading inside an ascending channel and is facing resistance just above the $450 mark. The trend remains bullish as both the moving averages are sloping up and the RSI is close to the overbought zone. A breakout and close (UTC time) above the channel can result in a quick rally to $638.55.
On the other hand, if the bulls fail to scale above the overhead resistance, the digital currency can again dip to the 20-day EMA, which is strong support. But if this support cracks, the slide can extend to the 50-day SMA and below it to the support line of the channel. We shall wait for a reliable buy setup to form before recommending a trade in it.
EOS/USD
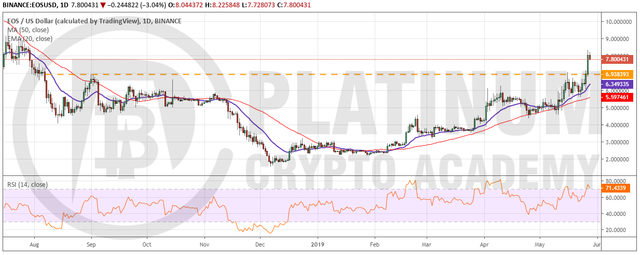
EOS bounced off the 20-day EMA and has cleared the overhead resistance of $6.938393 on May 27. This is a bullish sign. Both the moving averages sloping up and the RSI is in the overbought zone, which confirms that the bulls are in command. The cryptocurrency should now extend its rally to $9, where it is likely to face a stiff resistance.
Though we are bullish on the cryptocurrency, we would not suggest chasing the prices higher. We expect a retest of the breakout level of $6.938393 in the next few days. If the bulls succeed in holding the support, the digital currency is likely to start a new uptrend. Therefore, we recommend traders wait for a successful retest of the breakout levels and then buy closer to $7-$7.2 on the way up.
Contrary to our assumption, if the bears sink the price below $6.938393, EOS can dip to the 20-day EMA. If this support also gives way, it will lose momentum and might enter a consolidation.
LEARN HOW TO TRADE CRYPTOCURRENCY WITH A MASTER CRYPTO TRADER!
If you’ve booked your session above, we look forward to speaking to you soon!
Hopefully, you have enjoyed today’s article. Thanks for reading!
Have a fantastic day!
Richard Baker Live from the Platinum Crypto Trading Floor.
