Crytocurrencies trading : RSI Indicator Helper
Dewasa ini banyak sekali para netizen yang sedang menggeluti dunia trading Cryptocurrencies. Terdapat berbagai digital aset yang telah beredar seperti bitcoin, ethereum, dash, doge, dan steemdollar. Khususnya untuk para penggiat dunia maya ini merupakan suatu kegiatan yang cukup menarik. Mengingat profit yang dihasilkan kurang lebih seperti trading saham atau surat berharga.
Namun, hanya sebagian trader yang benar-benar memahami bagaimana teknik berdagang coin yang benar. Sangat banyak hal yang mempengaruhi naik turun suatu asset pada suatu pasar. Akan tetapi metode permintaan/penawaran masih dianggap suatu faktor tradisional yang masih punya andil besar dalam hal ini. Banyak trader percaya mekanisme jumlah permintaan/penawaran merupakan akan sangat mempengaruhi pergerakan harga suatu aset.
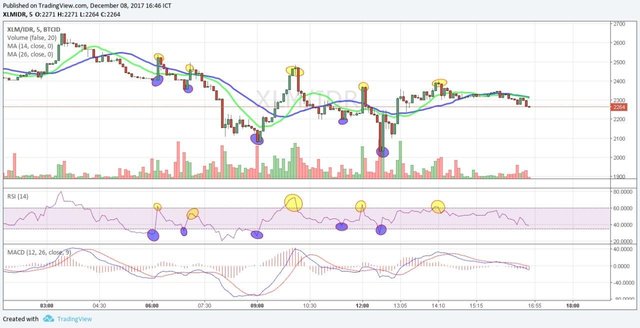
Oleh karena itu, saya akan coba untuk berbagi pengetahuan terkait dengan cara menanggapi pergerakan suatu kurva. Ada beberapa indikator yang dapat membantu kita dalam membaca pergerakan kurva dan menentukan posisi untuk membeli atau menjual. Akan tetapi saya hanya akan membahas penggunaan indikator yanga disingkat dengan RSI. Seperti pada gambar diatas terdapat lingkaran biru dan kuning. Lingkaran kuning merupakan dimana para trader memposisikan diri untuk menjual, dengan alasan titik kejenuhan pasar sudah mencapai puncak. Sedangkan pada lingkaran biru para trader memposisikan diri untuk membeli, dimana keadaan pasar telah mencapai posisi terendah.
Ini adalah pemahaman teori tradisional terkait dengan trading. Masih banyak faktor lainnya yang menjadi pertimbangan para trader seperti, event yang terkait dengan suatu coin/digital aset, adanya event HardFork, Fork, maupun ketangguhan aset itu sendiri mengahadapi pasar contohnya seperti Bitcoin yang disering disebut raja dari aset digital.
English text:
Today there are so many netizens who are in the world of trading Cryptocurrencies. There are various digital assets that have been circulating such as bitcoin, ethereum, dash, doge, and steemdollar. Especially for the activists of this virtual world is an activity that is quite interesting. Given the resulting profit is more or less like stock trading or securities.
However, only some traders really understand how the technique of coin trading is right. Very many things affect the ups and downs of an asset on a market. However, the demand / supply method is still considered a traditional factor that still has a big share in this. Many traders believe the mechanism of demand / supply amount will greatly affect the price movement of an asset.
Therefore, I will try to share knowledge related to how to respond to the movement of a curve. There are several indicators that can help us in reading the movement of the curve and determine the position to buy or sell. However I will only discuss the use of abbreviated indicators with RSI. As in the picture above there is a blue and yellow circle. The yellow circle is where traders position themselves to sell, with the reason the market saturation point has reached the top. While in the blue circle traders position themselves to buy, where the market situation has reached the lowest position.
This is an understanding of traditional theories related to trading. There are many other factors to be considered by traders such as, events related to a coin / digital asset, the existence of HardFork event, Fork, as well as toughness of the asset itself facing the market example such as Bitcoin is called the king of digital assets.
Salam
Newbie Netizens


done upvote me
https://steemit.com/photography/@schatengarg/i-ll-convert-ur-pic-into-a-stencil
Congratulations @mirzakreza! You have completed some achievement on Steemit and have been rewarded with new badge(s) :
Click on any badge to view your own Board of Honor on SteemitBoard.
For more information about SteemitBoard, click here
If you no longer want to receive notifications, reply to this comment with the word
STOP