Zane's Crypto Recap: STEEM 15 June 2017
Hello Everyone! What a day in the markets today! Looks like we might be in for an exciting and possibly bumpy ride soon in the crypto markets. I want to keep everyone up to date on the charts so let's get started!
Quick Take: As of 18:04 on June 15th, 2017 (GMT+6 hours)
$USD 24 hour change: -2.29%
$USD Weekly change: -24.26%
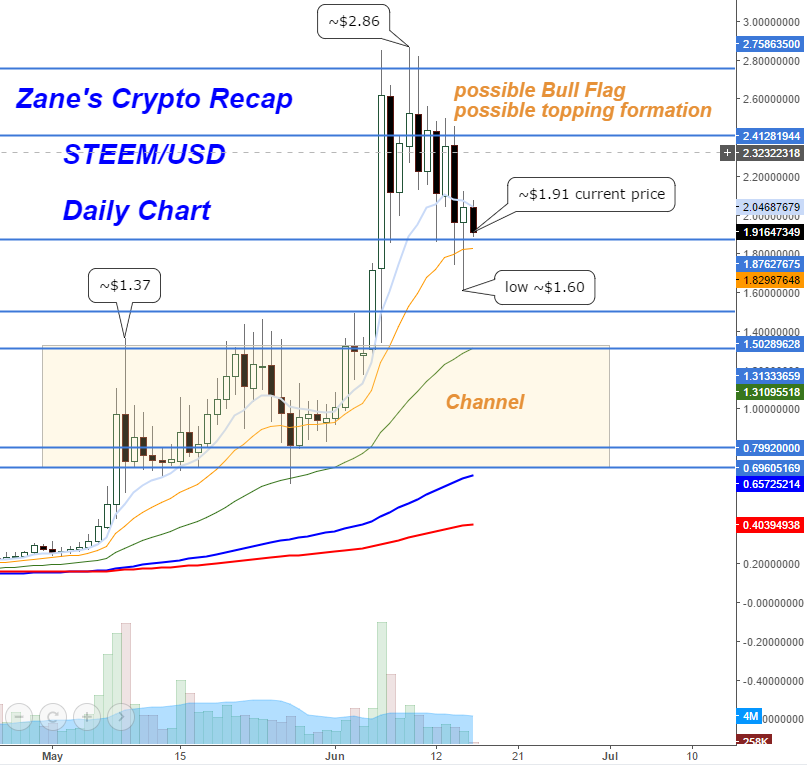
STEEM/USD Daily Chart
https://www.tradingview.com/x/CYBf5X2y/
Recent Action: A strong selloff in $USD terms began the day but price rebounded well off the daily 20 exponential moving average. Great sign for a strong trend to stay intact. The whole crypto space had double digit selloffs to begin the day so it was trading w/ the overall markets.
Support levels (in blue) are still being held as well so no major concerns yet for the overall trend.
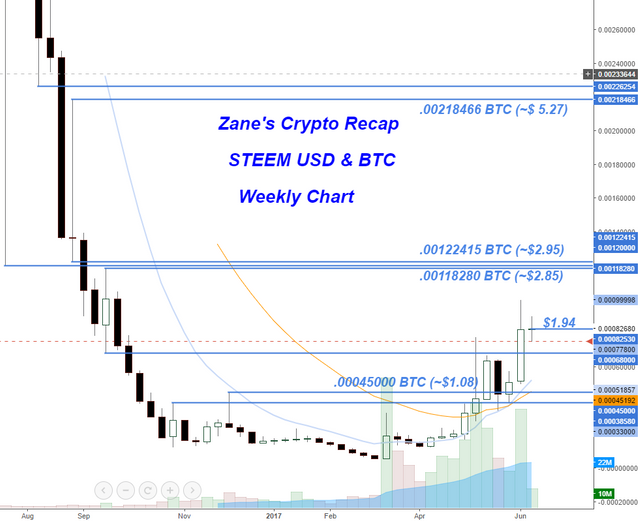
STEEM/(BTC&USD) Weekly Chart
https://www.tradingview.com/x/mKu9Gw5j/
Weekly Trend: Recent surges in volume have launched STEEM into a confirmed uptrend with plenty of room to go until reaching the $2.85-$3 level which will serve as psychological resistance and our first target from here.
Nothing concerning on the chart except for the recent move occurred so swiftly that it could take some time to settle in and rest until the 10 exponential moving average catches up to the price before more dedicated buying continues the trend.
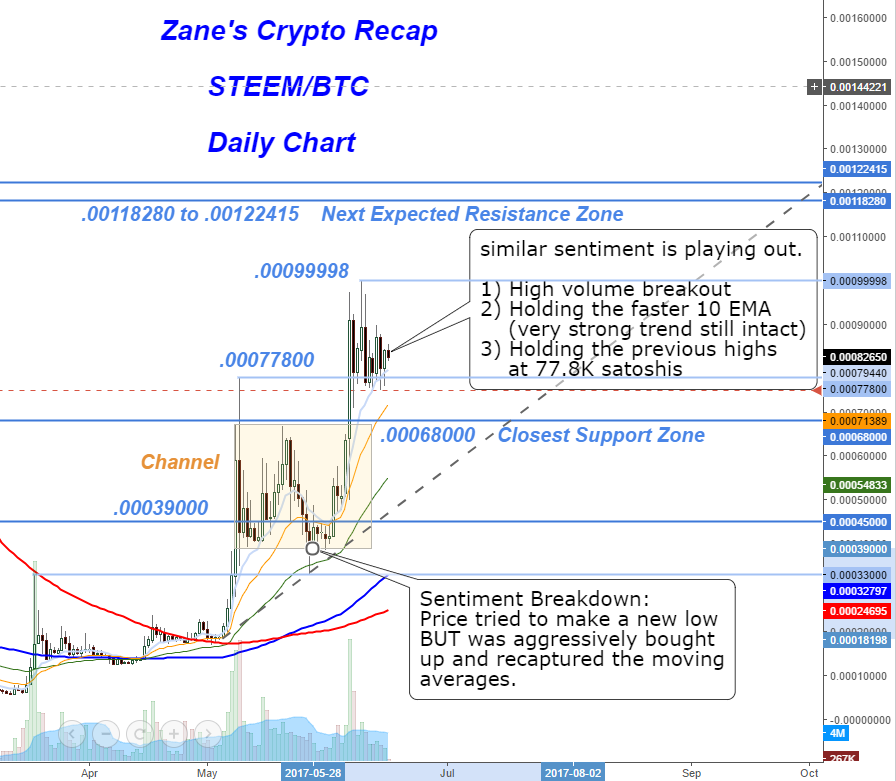
STEEM/BTC only Daily Chart
https://www.tradingview.com/x/SvAwuMKa/

Recently STEEM has broken out of another consolidation channel and continued its move higher.
.00099998 is the most recent selling (resistance) zone.
.00068000 is the most recent demand (support) zone.
If price dips into the .00033000 level then we will begin to see the trend weakening. Let’s not worry about that until we come to it. I’ll have my alerts set to keep on top of it.
The most likely short term downside I see is a resting/retrace back to the EMAs. For comparison, the last sideways consolidation lasted 1 month after breaking out. Despite being in strong trend it rested until the 50 EMA (green line) caught up. Let’s give it some time and see where it goes from here and analyze how it reacts to our price levels.
Hope all you Steemians enjoyed this recap!
Stay tuned and upvote if you would like to see more Crypto Recaps.
What’s on the Chart?
Light Blue = 10 Exponential Moving Avg
Orange = 20 Exponential Moving Avg
Green = 50 Exponential Moving Avg
Thick Blue = 100 Simple Moving Avg
Thick Red = 200 Simple Moving Avg
Horizontal lines = Support/Resistance areas
What’s Next for Zane’s Crypto Recap?
I plan on releasing a detailed chart each day on a rotating schedule.
I will alternate between STEEM, BTC, ETH, possibly DASH or other Top coins. I'm still flexible so please let me know what is in demand here.
I will also include in the rotation the most requested coin in the comments below.
So let me know what coin you would like to keep track of and let’s stay on top of this super exciting market together!
Request your favorite coin in the comments now!
-Zane


Welcome on steemit @inzan1ty. Cool analysis. Thanks for sharing.
Follow :-)
Thanks! Hope you enjoy and benefit from it.
great analysis! Looking fwd to your future posts. Please keep ETH and STEEM on your list.
Thanks for the suggestion. Will definately keep those ETH and STEEM in the rotation.
Thank you @Inzanity I have enjoyed this run. I hope the momentum continues until SteemFest. If not I will buckle down and do what I did from Nov-Mar, write everyday and build a nice war chest of Steem.
You're welcome @hilarski. I'm cheering for the rally to continue as well!