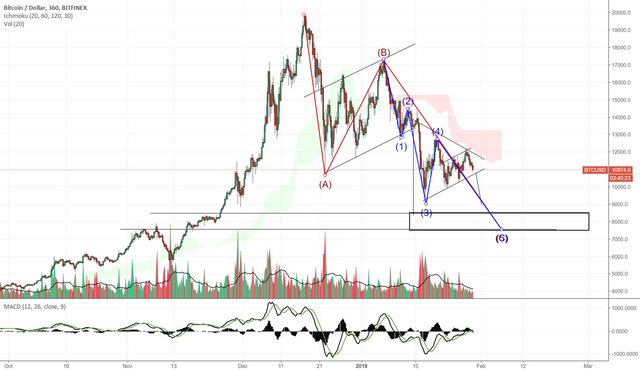
Bitcoin & fibs 13,327$ & a quick lesson in the description
In Todays News:
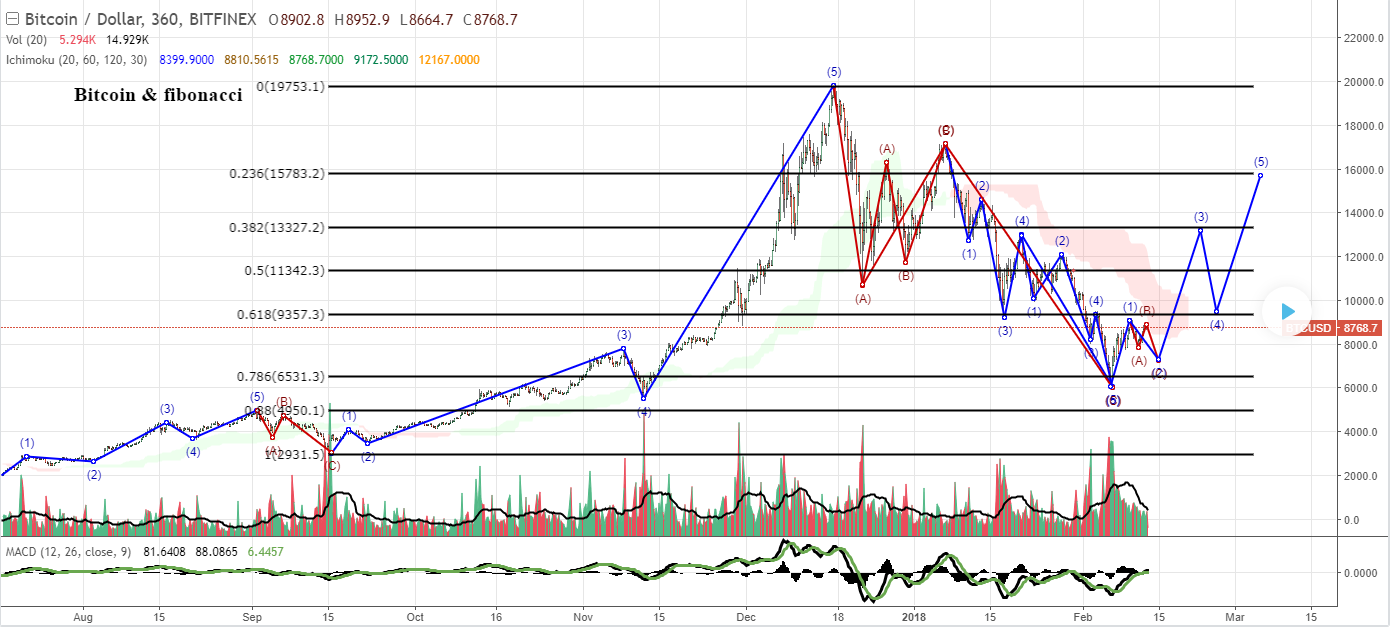
Here's a lesson in the relation between - LEGS - Elliott wave fractals & fibs
what is a leg?
A leg in a market is defined by a pump up or a pump down IE upwave or downwave IE impulse up or impulse down
the recent leg we witnessed is measured & starts at 2931$ in price at the top of the cycle IE LEG we saw prices reach 19753$
Now we are all expecting a bounce in this market then we could either see ATH's this year or the other possibility is a longer consolidation period / short term bear market the truth is no one truly knows but I vote favor in the probabilities of bullish but everyone has different trading styles and opinions on the market & is entitled to.
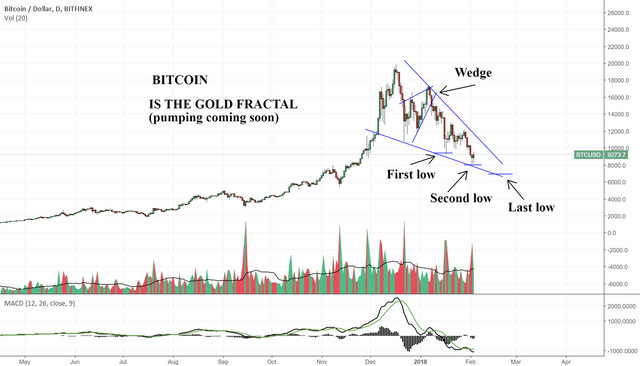
for me bitcoin -4.77% reminds me of the gold 0.48% fractals as I have shown in my other graphs on tradingview - examples ---
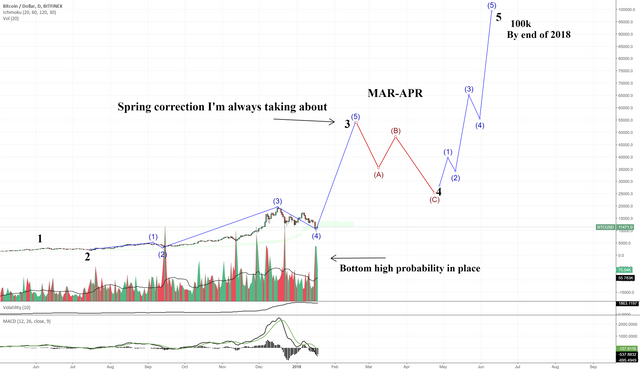
so I think Bitcoin -4.77% will reach new ATH's in 2018 but only time can tell I see sufficient volume for more ATHS we just need to watch the market structure in this bounce and get a better idea for the picture we are getting painted here with BTC -4.77% .
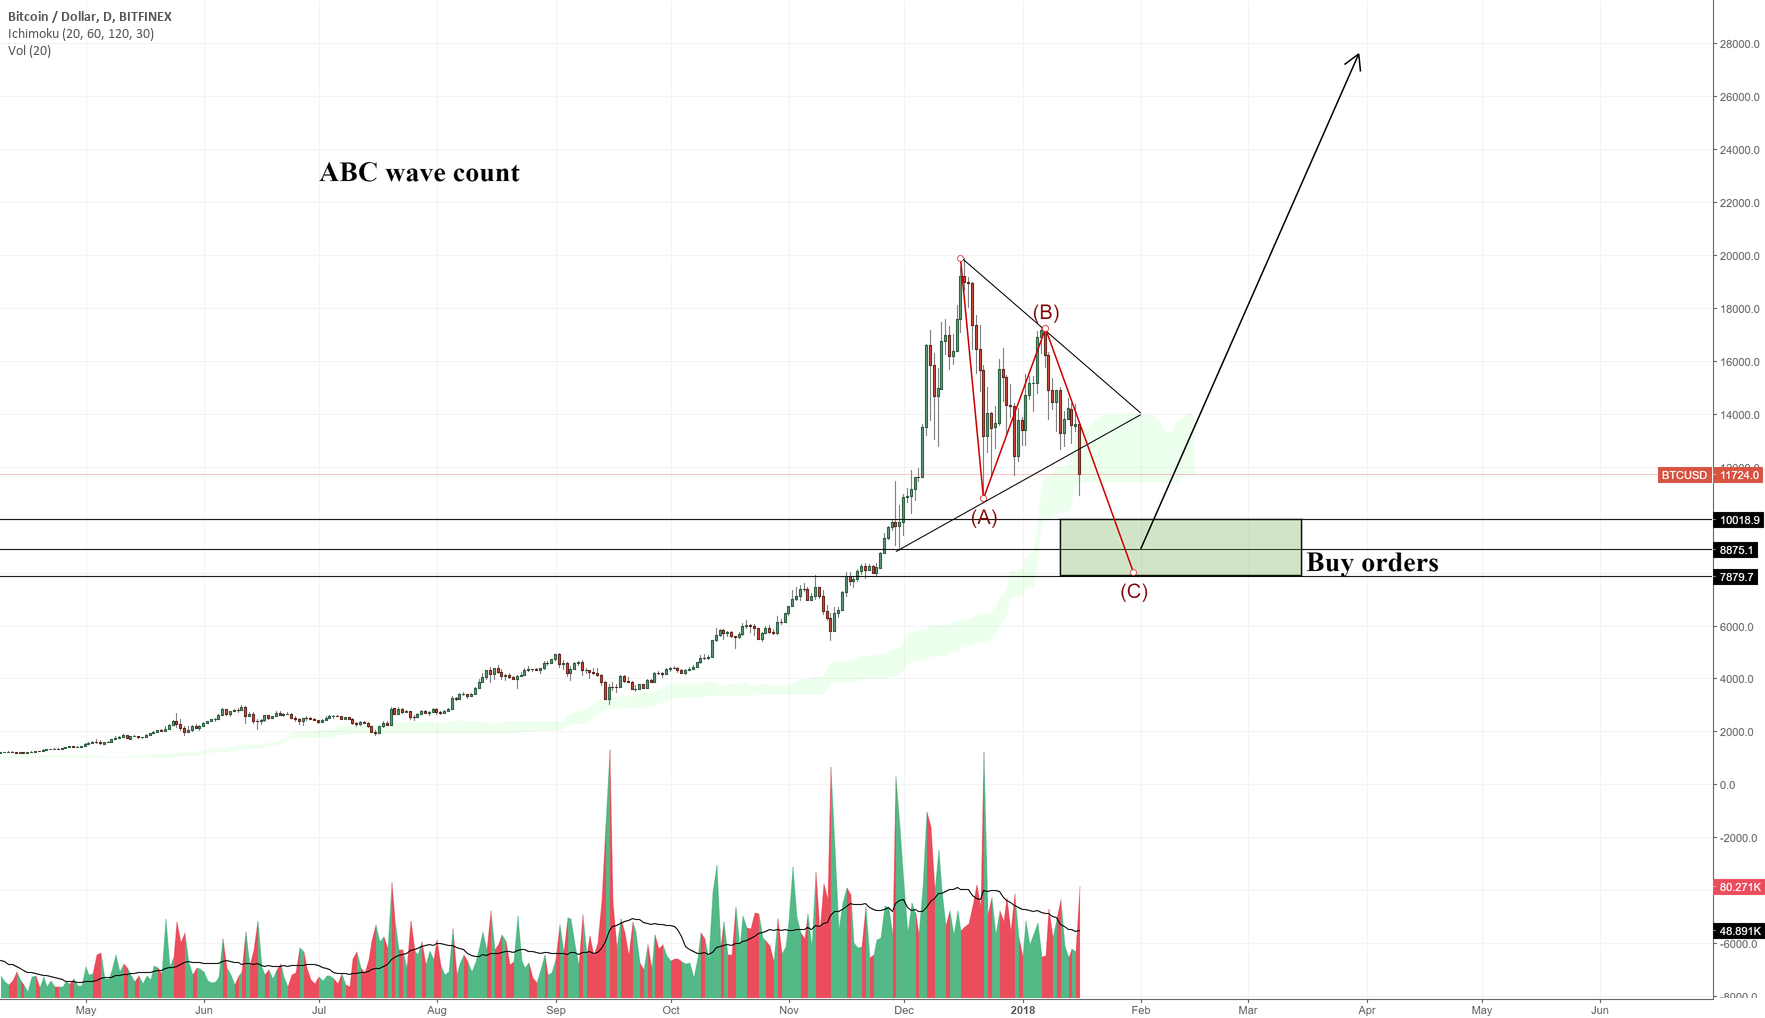
Here's some more of my recent work on BTC -4.77%
Follow for daily Updates.
Upvote, drop a comment if u find this usefull.
