A look back at Cryptos in 2022
The following charts show how last year turned out to be one of the most challenging years for digital assets
Two massive contagion events, macroeconomic headwinds, rising inflation, and aggressive rate hikes made 2022 a year that all crypto proponents would like to forget about. And the numbers show it all. I would summarize these challenges via a few charts below.
The data for the visualization was taken from a report published by Arcane Research. Although last year has been done and dusted, it has been agonizingly painful for the broader crypto market. The only true winners were the top exchange Binance and dollar-pegged stablecoins. So without further ado, let’s look at the data.
BTC Yearly Return Comparison
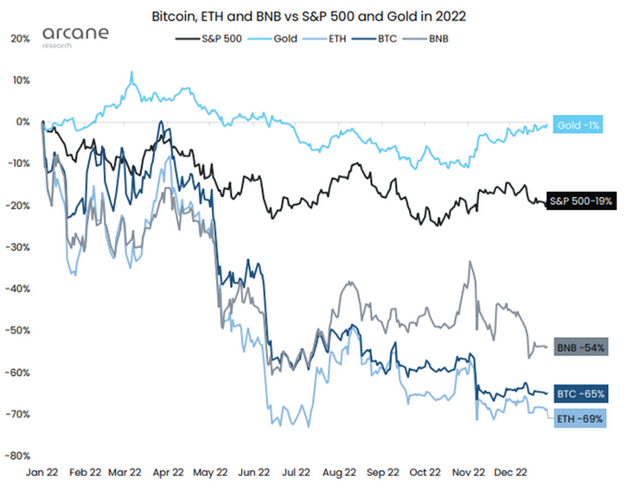
As it turned out, Bitcoin (BTC) posted the second-worst yearly performance since 2011 — ending the year **down a massive 65% **(Figure 1). 2018 was the only other year that posted a bigger BTC annual loss of 73%. Having said that, BTC was not the only casualty. The losses were seen across the board. In fact, Ethereum, the second-largest cryptos saw an even bigger yearly loss of 69%. Ironically, physical gold vastly outperformed BTC, as the latter’s digital gold narrative was thrown out of the window in 2022. Needless to say that these downward price pressures have vastly dwindled interest in other crypto trading instruments like futures and derivatives.
BTC Correlations
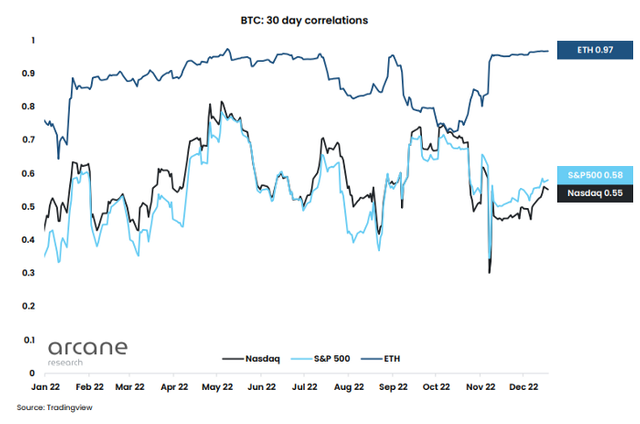
2022 was also the year when the correlations between BTC and U.S. equities remained historically high. As the tightening policies ensued, tech and growth stocks along with other riskier assets like cryptos fell into a strongly correlated environment (Figure 2). This environment favors the safety of the reserve currency, the U.S. dollar. Looking at the chart above, you can see the average 30-day correlation between BTC and ETH, the benchmark S&P 500, and the tech-heavy Nasdaq. Understandably ETH had a very high correlation of 0.97 with BTC, while the two stock indices posted 0.58 and 0.55 respectively.
Crypto Drawdowns
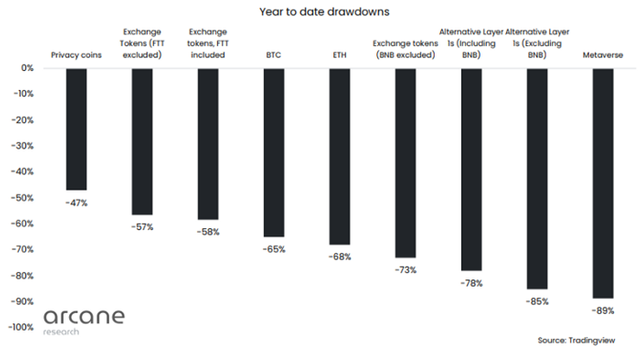
The extremely risk-off sentiment saw alternative Layer-1 crypto projects and the mythical Metaverse’s valuation take a nosedive — plunging more than 70% in many cases. An interesting observation here was a milder drawdown of -47% in privacy coins (Figure 3). This relative strength in privacy coins was attributed to the sustained utility of Monero (XMR) related to darknet transactions. XMR is one of the biggest and most well-known privacy coins. Also, a bit of a surprise was the outperformance of the exchange tokens, relative to BTC and ETH.
Binance Dominance
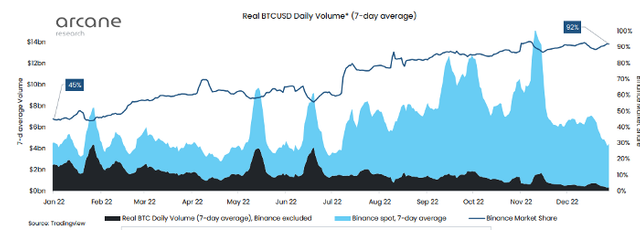
While Binance, one of the biggest crypto exchanges, benefited immensely from the lifting of trading fees for its BTC spot pairs this summer — the demise of another crypto exchange heavyweight FTX, gave it almost complete dominance in the space. By the end of the year, Binance completely overtook the spot market trading volumes, currently representing over 90% of the BTC spot market volume (Figure 4). We have to go all the way back to 2014 — to the collapse of Mt. Gox to find a period where a single exchange dominated BTC spot market volume in a similar manner. However, with only 25% of the BTC balance held at exchanges, it presents much less of a risk than compared to the Mt. Gox era.
Stablecoins Revival
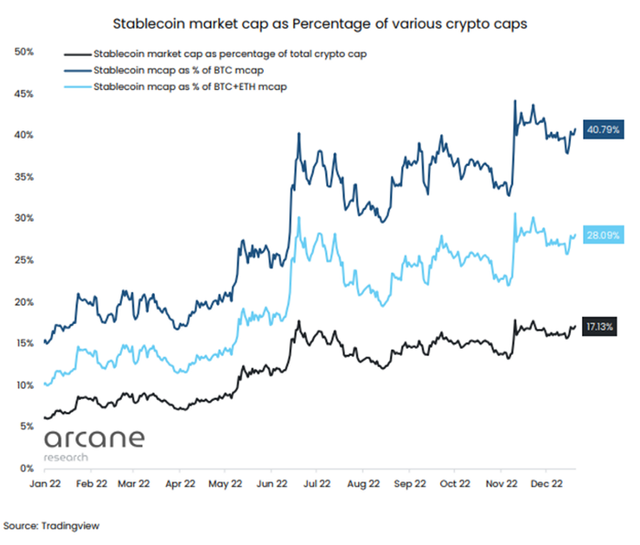
Though it felt like everything was falling apart in the Cryptoverse, there was one segment that flourished, and for a good reason. 2022 proved to be a good year for centralized, non-algorithmic stablecoins — Tether (USDT), USDC, and BUSD all saw their market share increase substantially throughout the year. As the chart above shows (Figure 5), the stablecoin trio currently has a combined market cap representing 41% of BTC’s market cap, 28% of BTC and ETH’s combined market cap, and 17% of the total crypto market cap. This was a significant gain from the 5%, 10% & 15% to begin 2022. Basically, these dollar-pegged stablecoins provided the safety of the dollar exposure, especially to investors in extremely distressed economies.
ETH DeFi TVL & Dominance
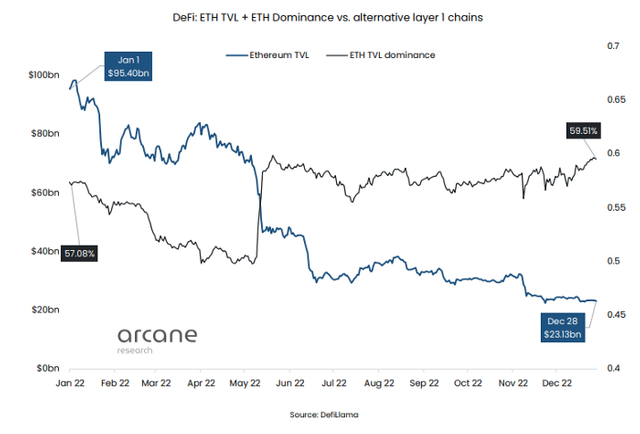
Moving on to Decentralized Finance (DeFi), it experienced a massive decline as well. The total value locked in Ethereum DeFi fell 76% in 2022 from $95.4B to $23.13B (Figure 6). Despite all the chaos that persisted in this segment, it has brought much-needed transparency and reliability in contrast to the centralized crypto lenders. Nevertheless, it has many challenges to address — the least of which are the frequent hacks that we saw in the last year. They amounted to $3B in 2022, as Ronin ($650M), Binance Bridge ($570M), and FTX ($450M) all got exploited for massive amounts.
OpenSea NFT Volume
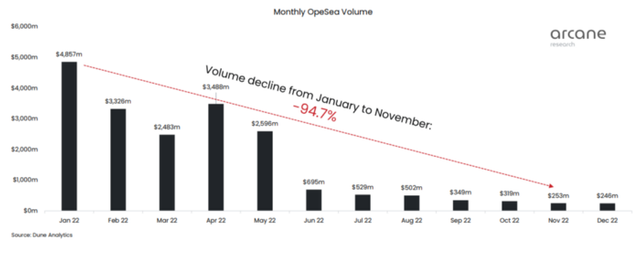
One of the biggest talking points in 2021 and the relatively new introduction to the crypto space, Non-Fungible tokens were hammered in 2022. One of the biggest NFT marketplaces, OpenSea saw a 95% decline from January to November as NFTs largely remain a niche in the crypto market (Figure 7). A revitalized strength in crypto down the line will likely contribute to rejuvenating the NFT market. In this environment, they will remain the underperformers.
Crypto Company Drawdowns
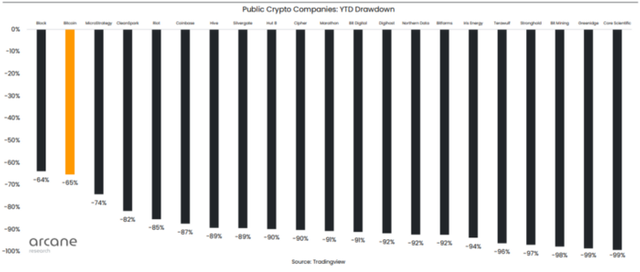
Moving on to public crypto mining companies, they suffered the same fate as most of the other segments. According to data (Figure 8), most miners faced year-to-date drawdowns of 90% or more. Crypto miners were incentivized to take on debt and rapidly expand their hash rate, but as the easy money evaporated, so did their profits. Most of the public miners bowed out in the face of an awful trifecta of higher interest rates, plunging BTC prices, and surging energy prices.
Layoffs
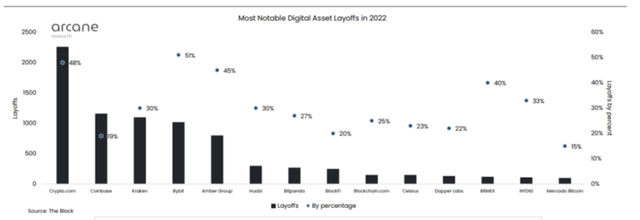
And finally, tech companies in the legacy financial system are not the only ones laying off employees substantially. According to The Block, companies related to digital assets experienced 9,564 layoffs in 2022 — slashing approximately 10% of the workforce (Figure 9). Despite that, employment within crypto is vastly higher than The Block estimated in 2018, currently estimated to a range of 120k-280k employees. There was still an outlier in 2022 — Binance doubled its size to 7,300 employees compared to one year ago.