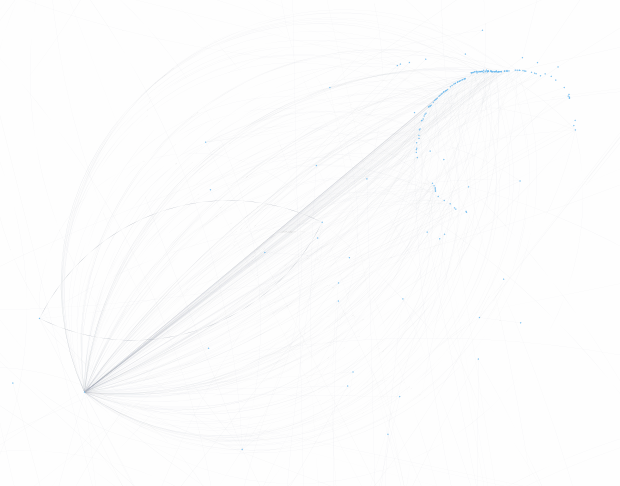
Data-driven art: a visualisation of a sample of ERC20 Tokens transactions
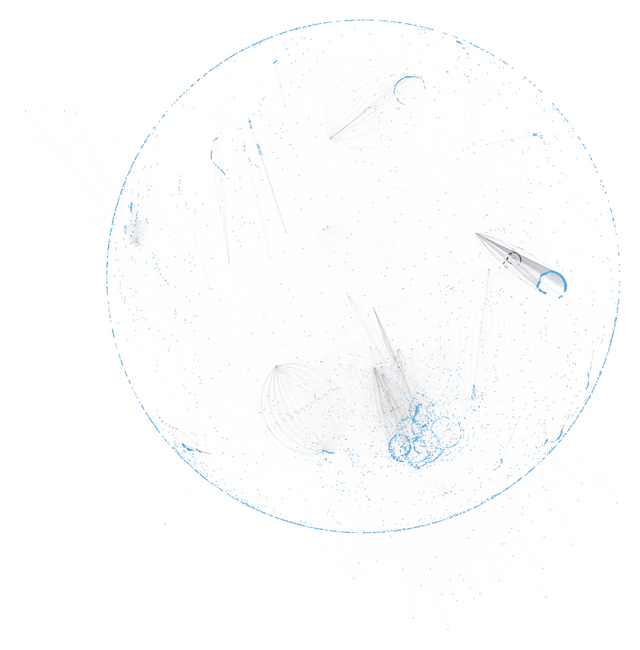
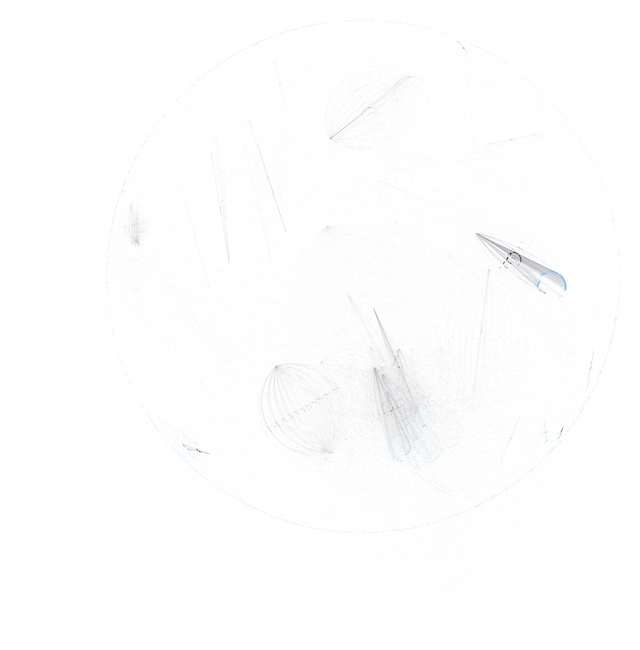
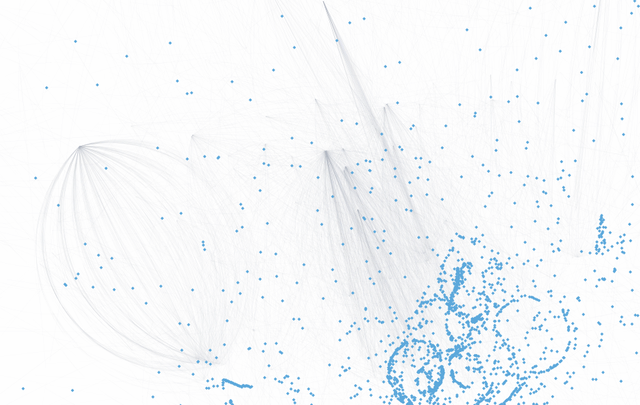
I tried to visualize some data about ERC20 Tokens transactions in Ethereum network while waiting for a database full sync. The sample that is showed on plots includes only 8000 addresses, but it already gives some interesting insights so I am looking forward to the full dataset
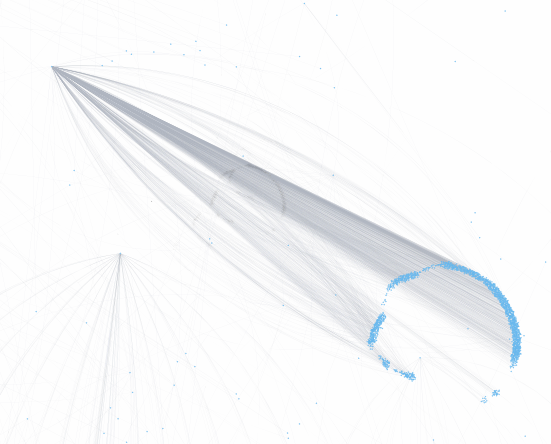
This graph definitely has some interesting clusters to dig in
https://drdino.com/are-you-going-to-heaven/
https://www.youtube.com/channel/UCxiEtqPja47nnqsJNrdOIQQ/videos
https://www.youtube.com/user/paulbegley34/videos
https://www.bible.com/bible
https://www.bible.com/videos
https://www.godssimpleplan.org/languages-in-print