BTC 7TH AUG
Little bounce and then down like expected but still lots of buy support around this area, the bulls know how important this area is to their case.
I am looking a bounce here, everything is short term and to be watched as it develops for more signs about what is happening, as we can bounce up to retest the highs from anywhere here.
https://www.tradingview.com/x/coqxkFWQ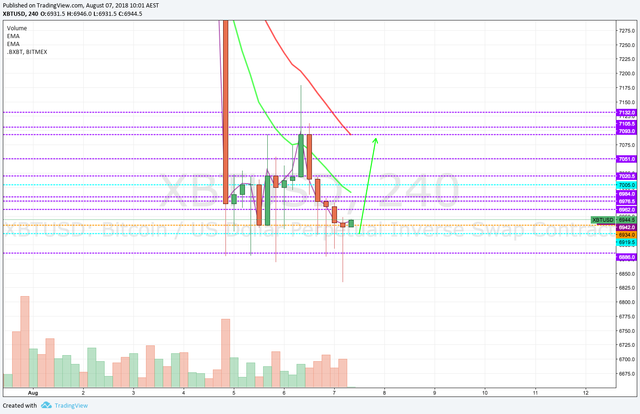
we got a short bounce and amazingly as almost always it hit bang on the 50% fib level retrace of that move down.
Can it go higher?
yes but maybe a short scalp down first.
https://www.tradingview.com/x/tGNuRb0d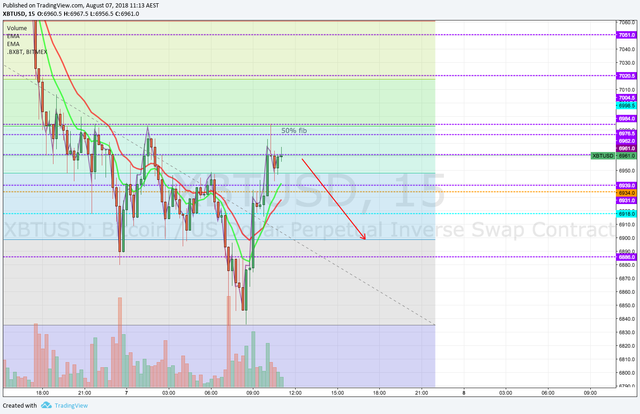
Lot of big wicks here in this range, lots of buying support, someone doesn't want it to go any further down.
We could bounce here, getting some bullish divergence on the 4 hr RSI, making a higher low.
Bullish close on the previous 6hr , so we will watch how that closes in 2 hr.
https://www.tradingview.com/x/M4Mxzb5l
The 6hr chart is looking pretty bullish. RSI is also making a bullish divergence.
https://www.tradingview.com/x/pYqP79aQ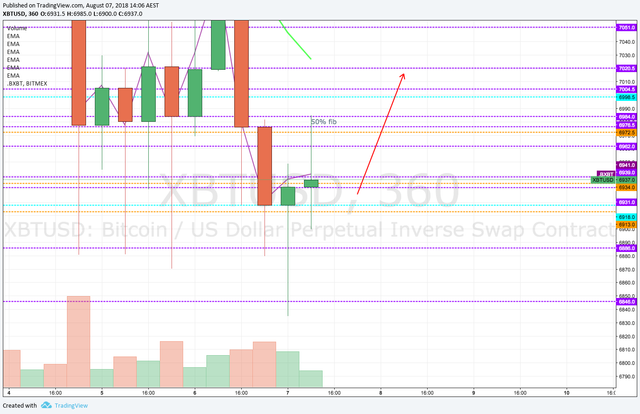
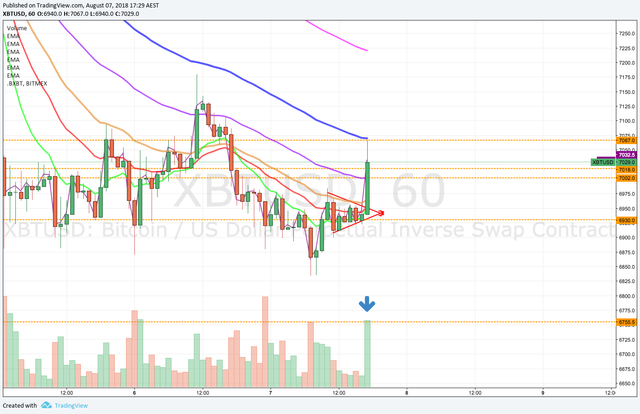
Possible bullish pennant break on the 15 min.
This lined with the bullish 4hr candle setup and also a bullish 6hr and bullish divergence in the RSI, on both 6 and the 4hr is making me short term bullish
Short term target $7020- $7050 and then let us see, we can go higher, could hit $7150-$7200 on this move and then I think we could hit $7500 over the next couple of days.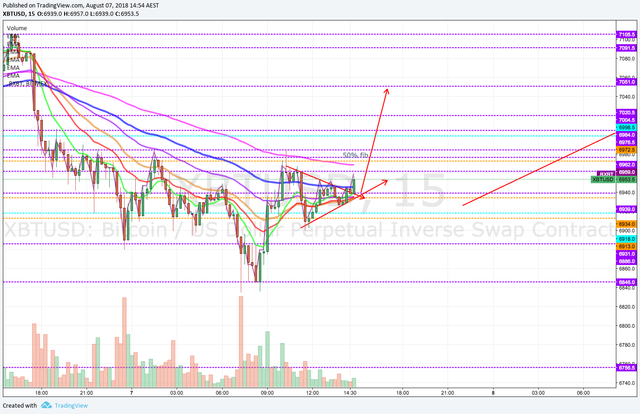 .
.
https://www.tradingview.com/x/mgfK1fRrand 6hr
We got a bounce out of teh pennant and with a small bit of volume.
Can this keep up?
If so we may get to the higher targets.
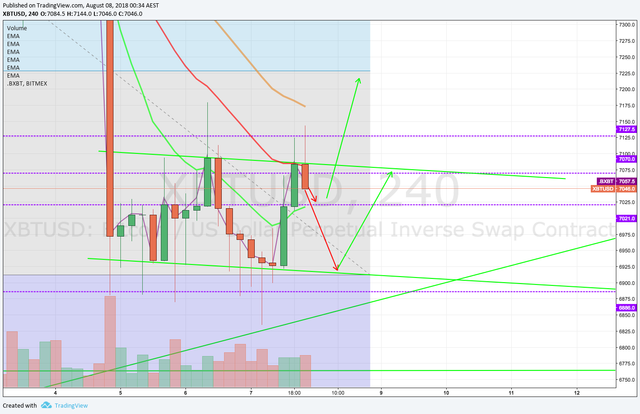
I will be watching the close of the 4hr and 15 and 15 min charts.
If we can't make a higher high on the 4hr I will be looking for shorts.
https://www.tradingview.com/x/z5Xi6K8c
https://www.tradingview.com/x/WAFbTo0A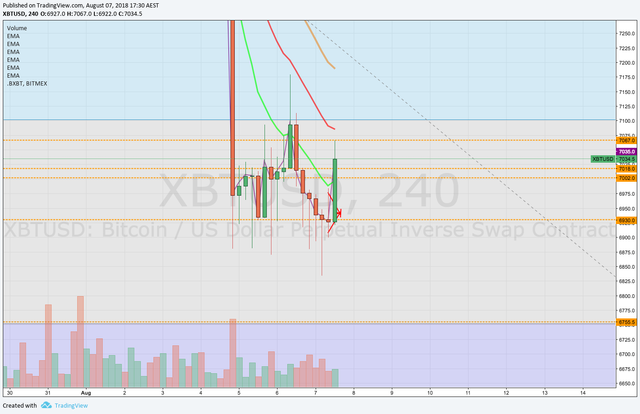
https://www.tradingview.com/x/Q4vCCXHs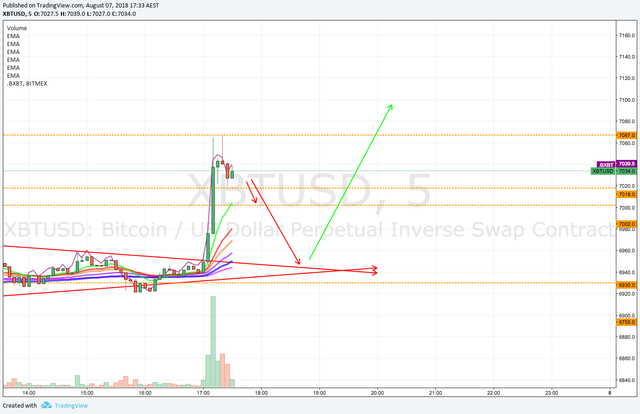
possible flag being printed on the 15 min, if volume can pick up we can get a highe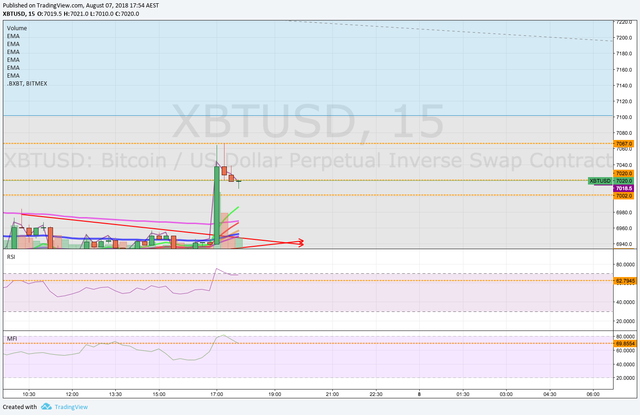 r high on the 4hr
https://www.tradingview.com/x/ITgQdk8f
possible breakout here need volume, next target $7120
https://www.tradingview.com/x/NYXmEmpY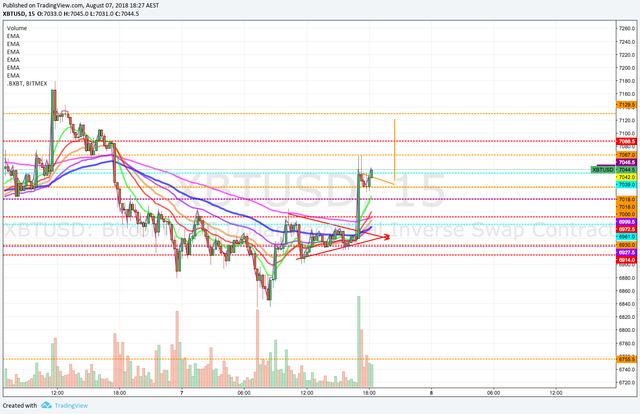
If it fails to make a higher high on the 4hr, I will 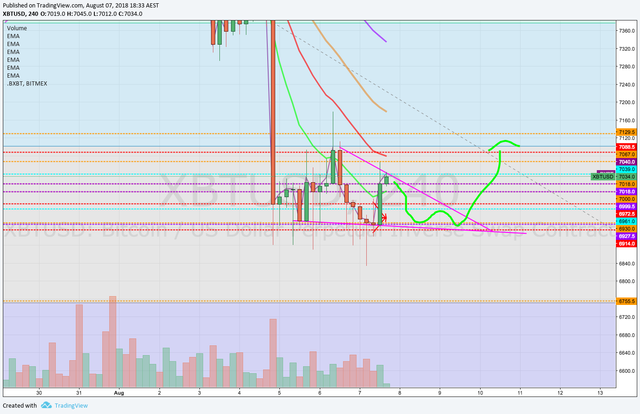 b looking at something like this to play out.
https://www.tradingview.com/x/p1pQn0C3e
This death cross on the daily is not good, we are also getting one on the 3 day and the weekly.
We need a massive spike to get us above these or they will drag us down.
So any bounces are short term.
The max i can see now is a bounce to the death cross at $7260 and then down to $6500-$6750
https://www.coinigy.com/s/i/5b695e88865d3/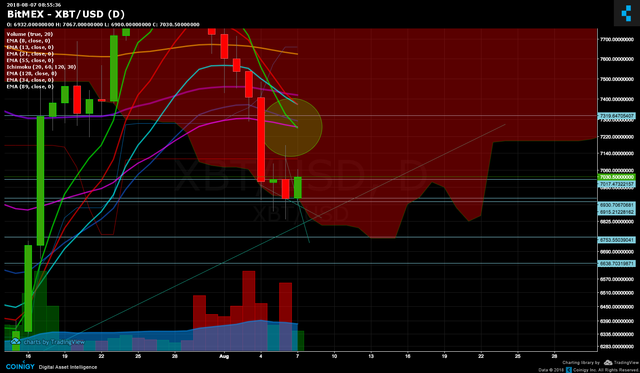
Hanging man candle on the 1 hr is it closes like this. RSI hitting resistance and rolling over.
We have a golden cross coming in a couple of hours, which might come exactly at 10 UTC, when we get a new 12,6,4 candle and could give us a pump up to the death cross on the daily.
https://www.tradingview.com/x/yyN7yYEh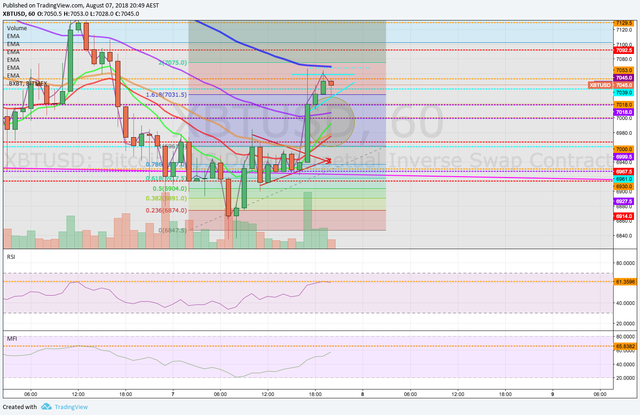
see how the 1 hr closes and watch this ascending triangle on the 15min, need more volume, but sellers are dying out.
Tar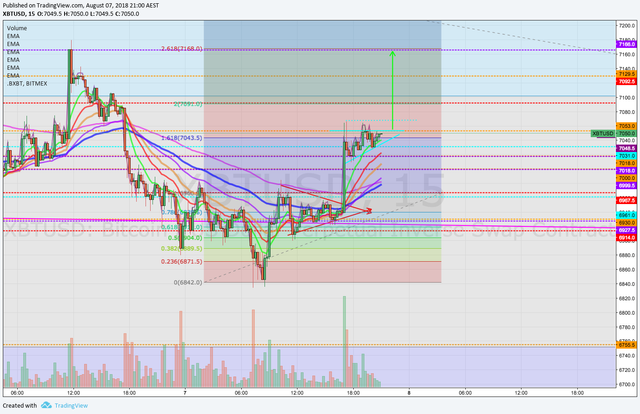
https://www.tradingview.com/x/aAn1JobHget $7162
We will assume we are in a trading range for now, this could go either way, important point.
Below $6750 I am bearish, but until then we could bounce anytime, I do think as I have been saying for days, that we need to test the breakout line at around $6750-$6800 first.
Let's see!!
