Bitcoin Price Weekly Analysis – BTC/USD Eyeing Crucial Break !!!!
Bitcoin price traded positively this past week versus the US dollar, and currently the BTC/USD pair is eyeing a major downside move.
Key Points
Bitcoin price traded positively this past week against the US Dollar to trade near $780.
At the moment, the BTC/USD pair is attempting to break a bullish trend line formed on the 4-hours chart (data feed from SimpleFX).
If there is a break and close in BTC/USD, there may be an increase in the downside pressure.
Bitcoin price traded positively this past week versus the US dollar, and currently the BTC/USD pair is eyeing a major downside move.
Bitcoin Price Trend Line Support
There was a nice upside move in BTC price this past week, as it moved towards the $780 level against the US Dollar. However, the BTC buyers were not able to retain the bullish bias, and as a result, there was a downside move. The price moved below the 23.6% Fib retracement level of the last wave from the $684 low to $785 high to initiate a downside move.
The most important point is the fact that the price moved below a bullish trend line formed on the 4-hours chart (data feed from SimpleFX of BTC/USD. At the moment, the price is trading near another bullish trend line. It holds a lot of value in the short term, as it is positioned with the 50% Fib retracement level of the last wave from the $684 low to $785 high. If there is a break and close below the trend line support area, it may increase the downside pressure.
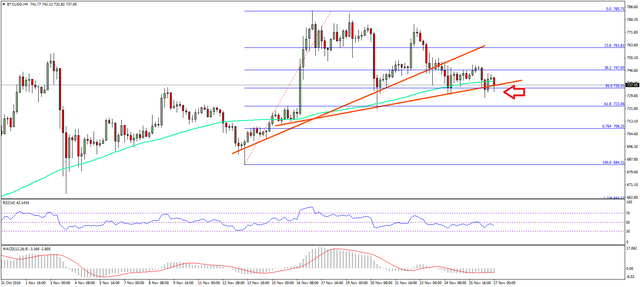
The last 2-3 candles are negative, and pointing that the sellers attempting to break the trend line support. So, the chances of a downside move are more. On the other hand, if there is a bounce, then the pair may challenge the last swing high once more. So, one may consider trading with a break or a rejection.
Looking at the technical indicators:
4-hours MACD – The MACD is currently in the bearish zone, and not showing further bearish signs.
4-hours RSI (Relative Strength Index) – The RSI has moved below the 50 level, which is a bearish sign.
Major Support Level – $730
Major Resistance Level – $750
Hi! I am a content-detection robot. I found similar content that readers might be interested in:
https://www.fxinter.net/en/free-realtime-forex-news.aspx?ID=179275&direct=Bitcoin%20Price%20Weekly%20Analysis%20%e2%80%93%20BTC%2fUSD%20Eyeing%20Crucial%20Break