January 2020 Yield Curve Update
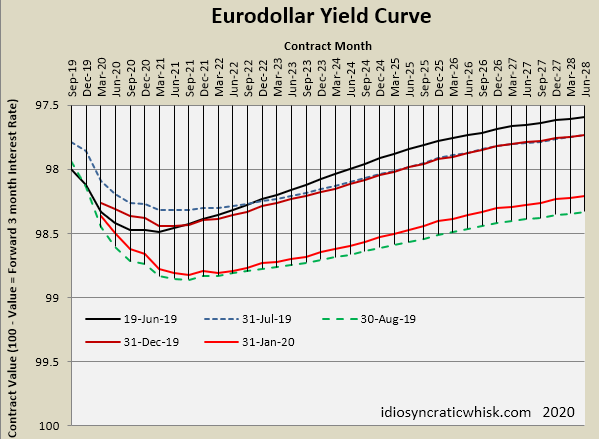
Interest rates have declined back toward the August lows (though they have bounced back up a bit over the past couple of days). Generally, this month has continued the trend that suggests the Fed will be a bit behind the curve, long term rates will remain low, and eventually they will have to lower their target overnight rate in an attempt to expand the money supply.
Euro
Dollar Yield Curve
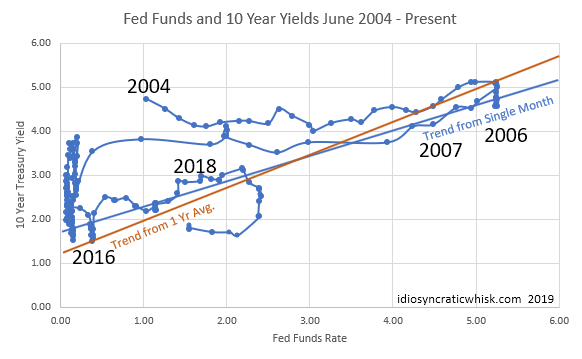
In the second graph, the bullish signal would be a 10 year yield pushing far above the regression lines. Those lines are my estimation of a de facto yield curve inversion. The pattern of recent recessions has been (as in 2006-2008) that the plots move to the left. Where we have avoided recession, the plots move to the left for a relatively short time, then move up significantly as long-term rates reflect improved sentiment. Either is still possible, but with each month below the inversion line, a move to the left is more likely.
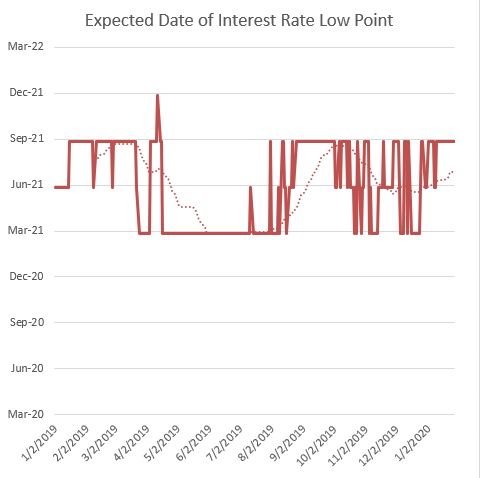
The last graph is an indication of Fed posture measured as the expected low point in Eurodollar rates. The further into the future the expected date of the last rate cut is, the more likely it is that the Fed has been too slow to react to poor sentiment. It remains at September 2021, and looking back at the first graph, one can see that, if anything, it is more likely that the low point will move to a later date rather than to an earlier date, compared to the similarly low August yield curve.

Unless another Fed cut or a significant unexpected positive shock improves sentiment, it seems like there might still be some room for bonds to go higher before this turns.

Hi! I am a robot. I just upvoted you! I found similar content that readers might be interested in:
https://seekingalpha.com/article/4321867-january-2020-yield-curve-update