Bitcoin Technical Analysis: IS THE BOTTOM IN?

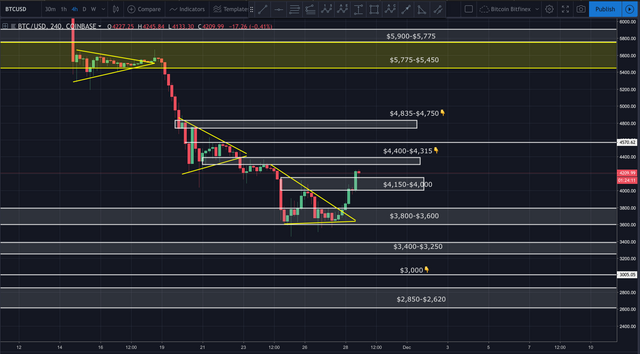
Bitcoin was able to break back above the critical $4,000 price point. It’s currently trading around $4,160. We’re seeing an uptick in volume, with buyers stepping in when price pulls back. This is at least a temporary sign of strength.
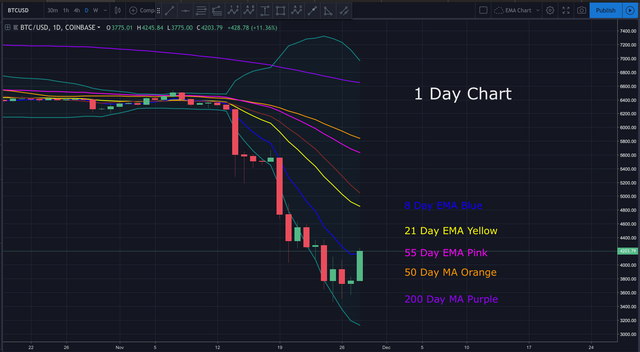
Looking at the daily chart, we can see price broke above the 8 day EMA. If the daily candle closes above the 8 day EMA, it’ll be another positive sign the bulls are strengthening.
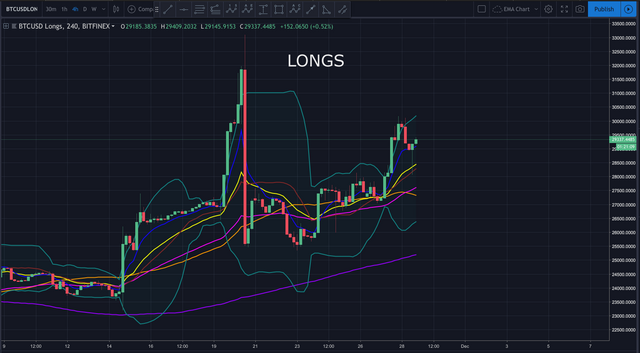
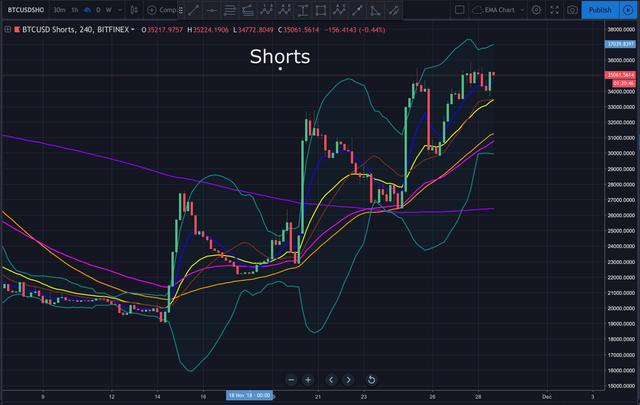
Shorts are stacking, out pacing longs by about 20%. If this gap widens above 30%, we may see a major short squeeze. Conversely, if longs start to out pace shorts, we could see price drop back below $4,000…especially if volume drops. In today’s video analysis I discuss, where price may be heading next, traps to avoid, key areas to watch and so much more. I hope you find it helpful.Video Analysis:
If you don’t see the above video, navigate to TIMM (https://mentormarket.io/profile/@workin2005) or Steemit in order to watch.
I hope this has been helpful. I’d be happy to answer any questions in the comment section below. Until next time, wishing you safe and profitable trading!
Workin
Open an Account on Binance here:
https://www.binance.com/?ref=16878853
Support the Crypto Ecosystem with Brave Browser:
Twitter handle is @Workin2005 and Facebook is https://www.facebook.com/Workin2005
Published by [upme id=author]
on


Are we talking about THE bottom or an intermediate bottom??...
Temporary. Until we see CONSISTENT daily volume above $10 billion, I’ll remain skeptical of the sustainability of any spike in price.