January 2021 Update to the Bitcoin Supply Driven Trend Model
This is simply an update of the plot in the observation published here https://steemit.com/bitcoin/@kenraphael/bitcoin-currently-sits-at-its-lower-bound-of-its-long-term-trend-which-should-likely-hold in Nov 2019.
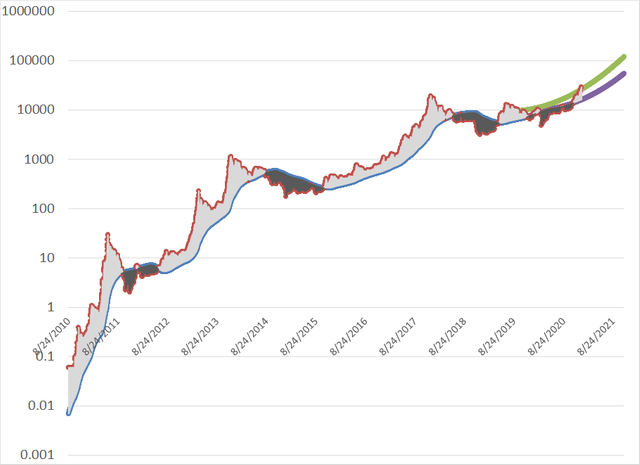
Compare the trends predicted there to the updated plot below.
Three observations can be gleaned from the update.
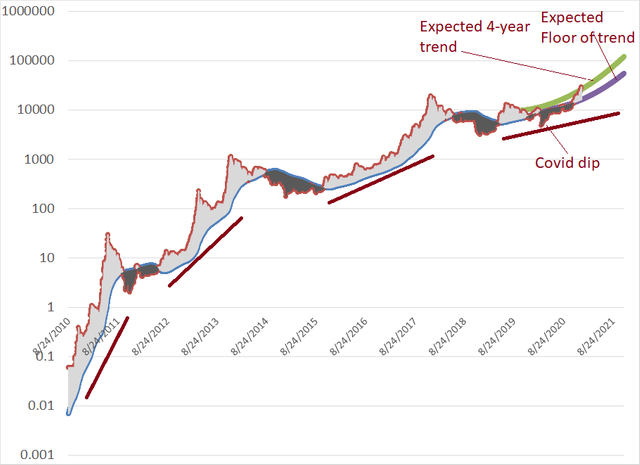
It appears the trend has reverted back to the expected line, shown in green.
Also, the lower bound of the 4-yearly run was clearly violated in a manner that was not seen in the prior runs during the prior 3 halvings. The major break of the floor was in March 2020 following the worldwide shutdown.
The current point at 30k is not abnormally high compared to the expected trend, even though it's a historic ATH.
In conclusion, it looks like the behavior is back to what is expected. This would likely mean continued net increments along the expected trend line. Looking at the second run, it is also possible that the current thrust will continue up in a parabolic manner just as there were 2 parabolic segments in the 2012-2013 run. There remains a low probability, as in a swan event where the floor could be breached. A swan event like was seen in the pandemic, the type of which was last seen a century before last year's, or a major intergovernmental push to inhibit access to the asset. It is not feasible to imagine all such possible swan events. However, the probability, based on the constant halved supply, and the pressures currently expressed in the DUA, will be to follow the expected trajectory (green line) for some time until the parabolic thrust that usually brings the trend to an end.
Legal Disclaimer: I am not a financial adviser and this is not financial advice. The information provided in this post and any other posts that I make and any accompanying material is for informational and educational purposes only.I can sometimes be reached on Discord at: https://discord.gg/shzKrPh.

