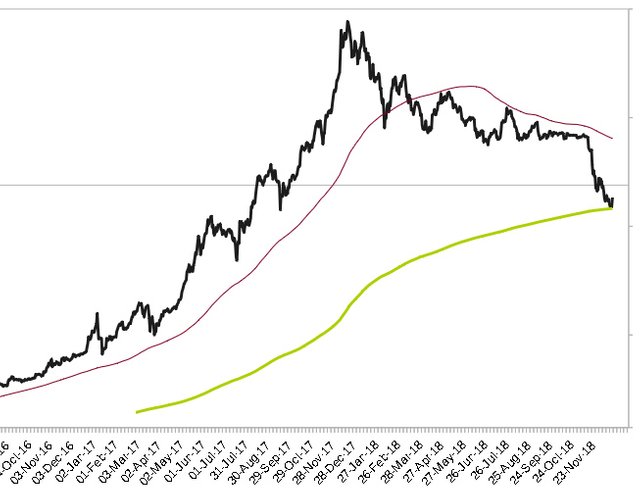
Can Bitcoin stay above the 200 week moving average?
I saw people mentioning that Bitcoin hasn't closed below the 200 week moving average in other bear markets. I couldn't find a decent chart, so I made my own, using a logarithmic scale. Then yesterday, there was a bounce off the 200 week moving average. This is actually a 1400 day moving average, I'll have to work on a weekly chart but it gives an idea of where the line is. I also need more data, as I don't have enough to see what happened in the last bear market.
I hope there isn't a close below the 200 week moving average, as this bear market is getting boring. There could be a large move through this line but then hopefully it will reverse within the week and close above it. If there is a weekly close below it, this bear market could still have a long way to go. This isn't trading advice, just my observations.
Edit, found a good chart to keep an eye on this https://www.barchart.com/shared-chart/%5EBTCUSD?chart_url=i_1545214948_1464784760&page_url=%2Fcrypto%2Fquotes%2F%5EBTCUSD%2Finteractive-chart%3Fid%3D935914

You just planted 0.07 tree(s)!
Thanks to @wayoutwest
We have planted already
5480.58 trees
out of 1,000,000
Let's save and restore Abongphen Highland Forest
in Cameroonian village Kedjom-Keku!
Plant trees with @treeplanter and get paid for it!
My Steem Power = 31960.67
Thanks a lot!
@martin.mikes coordinator of @kedjom-keku