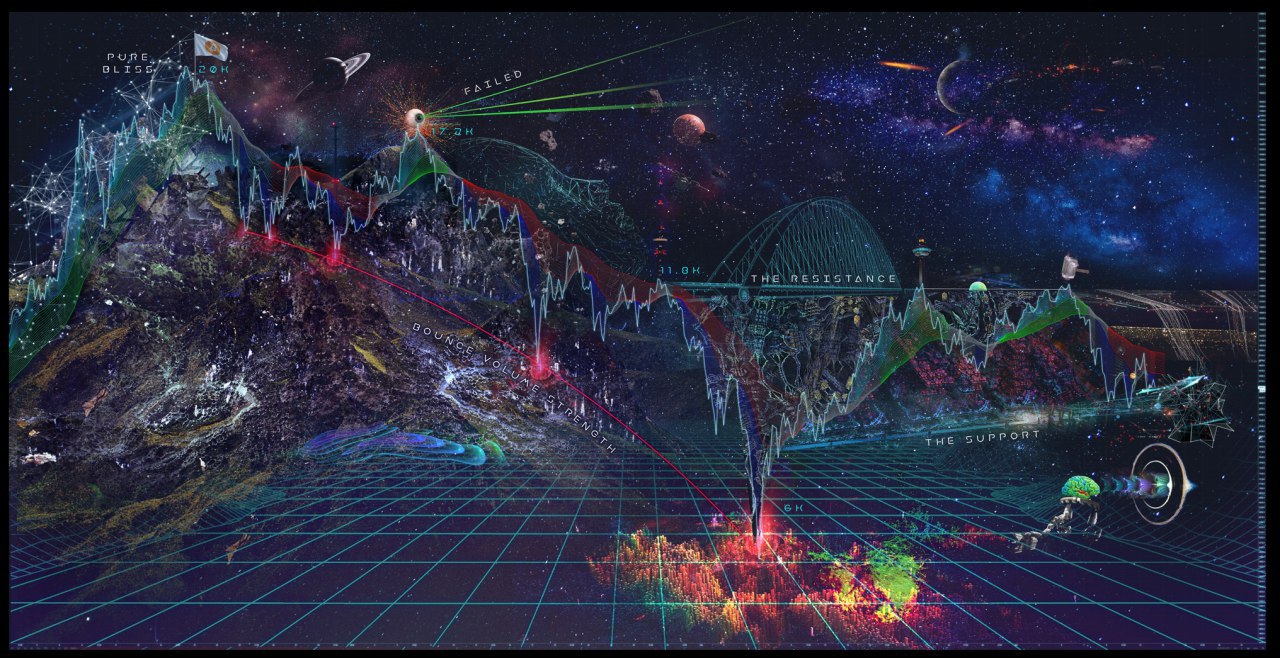
First HD BTC chart
it maybe difficult for you to understand what is happening in the charts but let me tell you some facts :
BTC consolidation around 8000-8400$ levels , and we are expecting another bearish trend if BTC doesn't hold this level, yesterday BTC had a bounce from 7600$ levels —> 8300$ , still not bullish because alot of FUDs and negative news in market.
IF BTC goes down then the next stop will be 6000$ , but this will only happend if BTC breaks 7500$ support which is a massive one !
and if BTC continues rally towards then we can see 9200$ level before further sell off or dump!

Boost Your Post. Send 0.100 STEEM or SBD and your post url on memo and we will resteem your post on 5000+ followers. check our account to see the follower count.