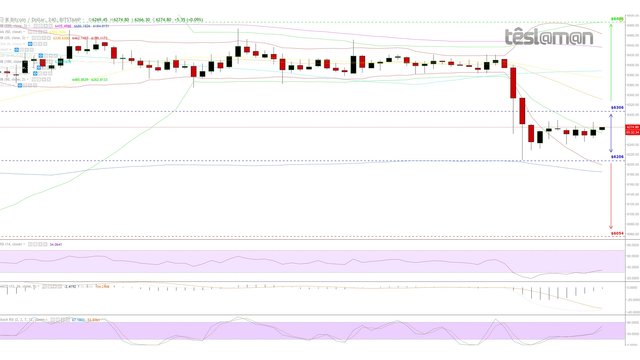
30 Oct 18 - Bitcoin Snapshot
4H Chart - Price Key Points:
- Breakdown from approx $6394 followed by a stabilization at approx $6243.
- Average support at approx $6264.
- Overhead resistance at approx $6388.
- RSI, MACD and Stochastic RSI display positive divergences.
- Volume declining as prior to any move.
- Models suggest that a buying attempt might be possible.
Possible Scenarios:
Long: On a confirmed break above $6306 – Price Target $6486 | Probability: 42% | Signal Strength: 5/5
Neutral: Price Range $6206 - $6306
Short: On a confirmed break below $6206 – Price Target $6054 | Probability: 35% | Signal Strength: 3/5
Our Stance: Speculative long.
