28 Oct 18 - Bitcoin Snapshot
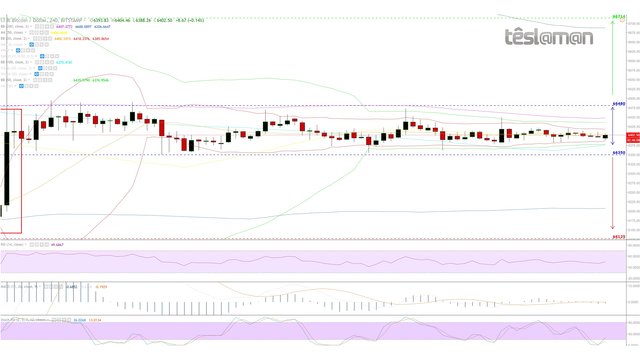
4H Chart - Price Key Points:
- 2 weeks without any significant direction.
- Symmetrical triangle intact.
- 20MA, 50MA and 100MA Bollinger bands extremely narrow.
- 200MA resistance at approx $6447.
- Indicators attempting to set a bottom.
- Models suggest that the next major move is getting near.
Possible Scenarios (unchanged):
Long: On a confirmed break above $6480 – Price Target $6714 | Probability: 40% | Signal Strength: 5/5
Neutral: Price Range $6350 - $6480
Short: On a confirmed break below $6350 – Price Target $6125 | Probability: 36% | Signal Strength: 3/5
Our Stance: Speculative long.

Congratulations @teslaman! You have completed the following achievement on the Steem blockchain and have been rewarded with new badge(s) :
Click here to view your Board of Honor
If you no longer want to receive notifications, reply to this comment with the word
STOPTo support your work, I also upvoted your post!
Do not miss the last post from @steemitboard: