You are viewing a single comment's thread from:
RE: Bitcoin Trend / No. 500 / Bullish With Small Bearish Divergence
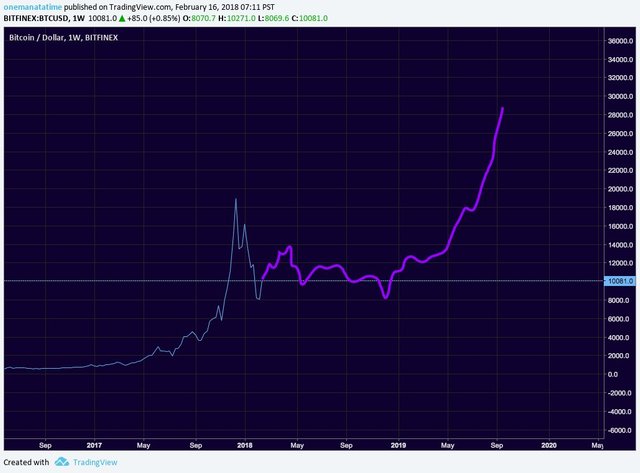
I can see that you have been expecting a new all time high at $25,000 this year. But I want to ask your opinion about this one. I don't really know much about technical analysis, but is it really possible to compute for the path of least resistance or is this pure speculation?
https://twitter.com/onemanatatime/status/964518046713851904
Thank you in advance.
I checked the chart..
The price might go there ( I mean the top )
No one know exactly how much will be ( but likely around or above 25K )
I understand that you are studying the charts to analyze the trend. But the photo I posted is from another person I just saw on Twitter. I just want to know if there is a thing called "path of least resistance" in technical analysis or this person just drew some random lines on the chart? hehe
Yes
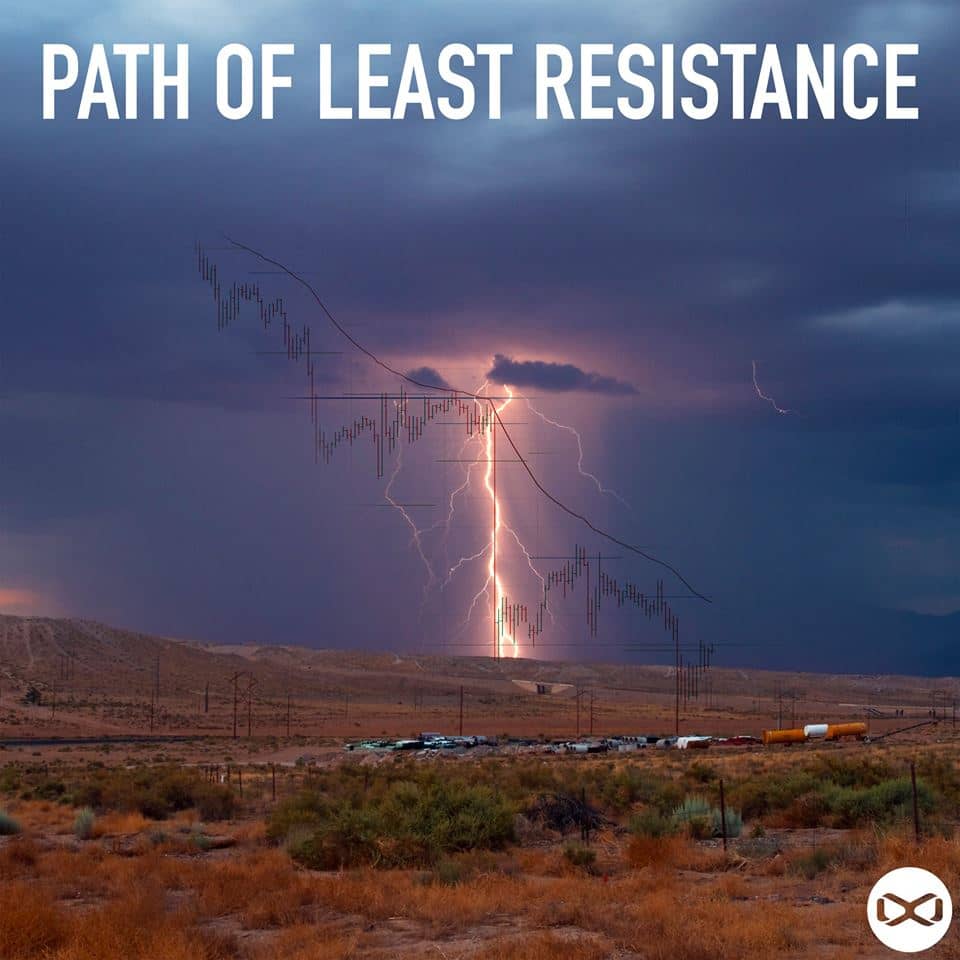
In trading some use "The Path of Least Resistance"
Oh, I see. Thank you for taking time to answer my questions and for providing great market insights! :)