BTCUSD - Technical Analysis October 19, 2017 - Current Price $5625

BTCUSD
The United States Attorney General just came out and voiced his concerns about Bitcoins potential use on the Dark Web within black markets and it may or may not have precipitated this little pullback, but the headline is reason enough to have a look with the Hard Fork coming up in just over a weeks time.
The last time we were looking at bitcoin we had called to go bullish above the 4400 and be cautious of a pullback in the 5800s, BTC had subsequently fallen to the low $5100 before dip buyers came in, no doubt looking to take a position ahead of the fork on any pullback.
Daily
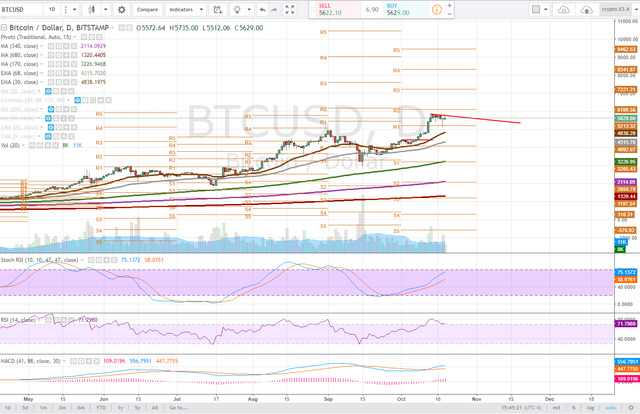
On the Daily timeframe, plain as day this is a bull flag forming and you will see it even clearer when we move to the intraday timeframes for a closer look. Trendline resistance is illustrated by the red line, and this is key for bulls to break above. Bull flags can take quite some time to play out and are not necessarily a 100% probability of bullish action, but it increases the Risk-Reward Ratio for bulls.
During the pullback, BTC had fallen below R1 pivot support before quickly being bought up and wicking back up to a flat close just yesterday.
It is possible to trend lower to restest r1 and if it fails, the 30ema is just slightly below. These supports will be key areas to see the bulls defend.
The Stochastic RSI is still trending upwards and bullish MACD cross occurred while the RSI is still not in overbought territory. This bad boy consolidating and has room to run as soon as it breaks above that red trendline that forms part of the bull flag channel.
4 hour
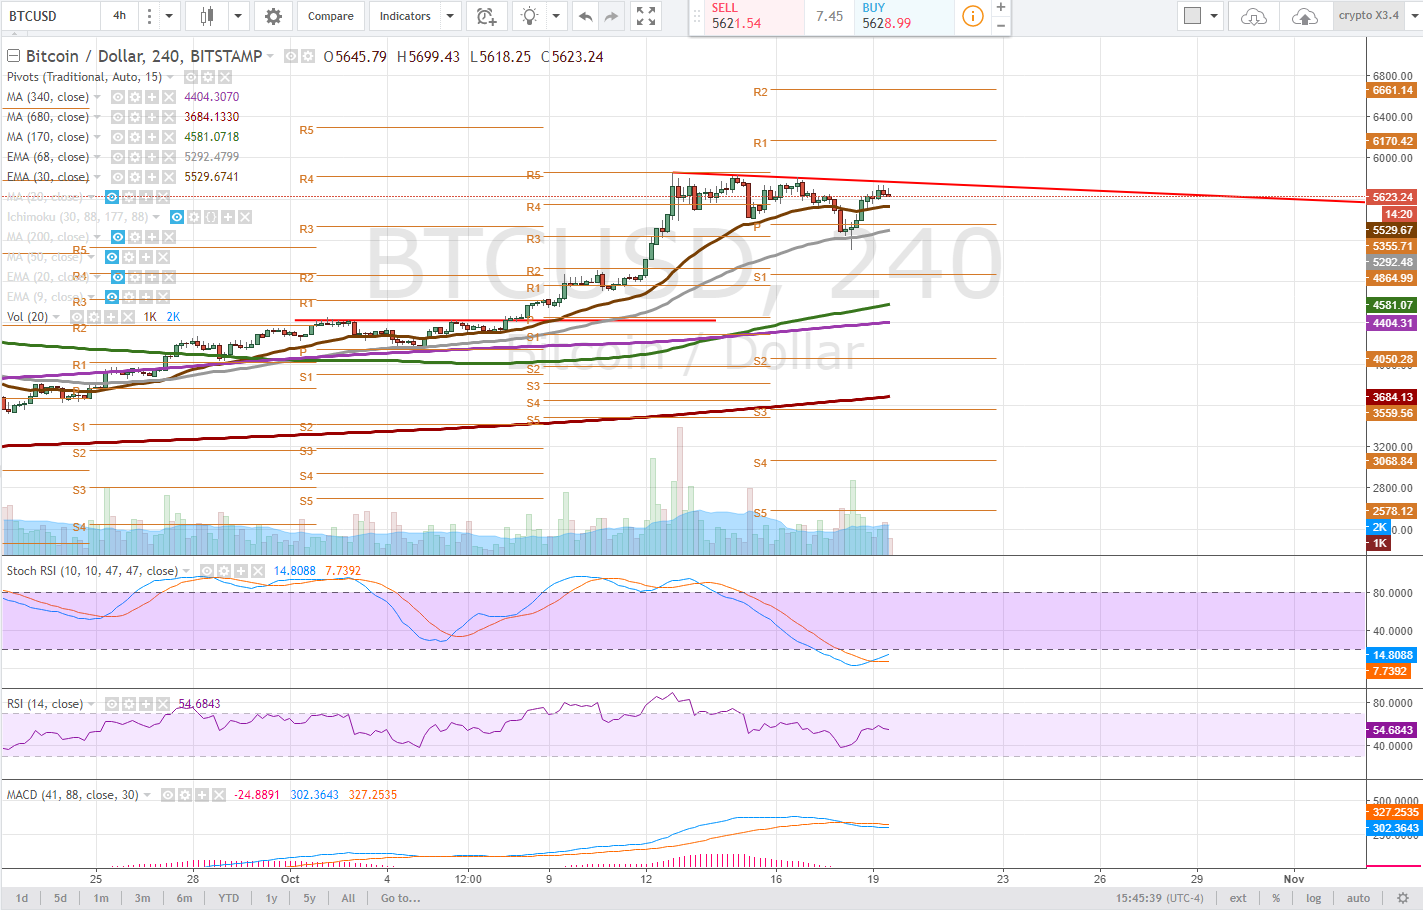
On the 4 hour taking a closer look at this bull flag, the price has tested the pivot, falling below but finding support at the 68ema (grey line) and the price is not only above all moving averages, which is bullish, the 170dma had a bullish cross above the 340dma. Very nice.
Traders should be looking for the price consolidation to continue and it is fairly likely that the price retests at least the 30ema (brown line) before we break out of this bull flag if at all.
The Stochastic RSI has reached downtrend and the RSI is in neutral territory as low volume consolidation is underway.
The MACD did have a bearish cross though the strength of it seems to be nominal and well within the metrics for this kind of price action and chart formation.
1 hour
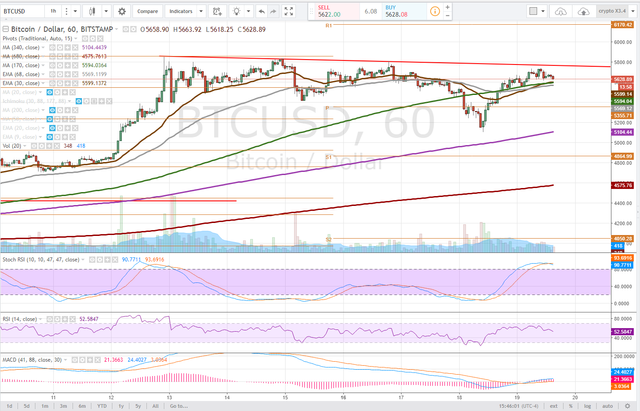
On the 1 hour time frame, it's important to note the convergence of moving averages, the 170dma and our 30 and 68 ema are all lingering together while the stochastic RSI is in an uptrend. Bulls would like to see any test of these moving averages result in a bounce and eventual bullish cross. Shorter period moving averages above longer is bullish, conducive to price progression.
If we lose that moving average support bulls will look for the 1 hour pivot to hold approximately $5355 - a possible opportunity to buy the dip ahead of the fork.
The MACD did have a bullish cross but like on the 4 hour, nominally - which fits the profile of a bull flag, low volume consolidation.
The real key here is breaking above that trendline and confirming the bull flag - Setting a lower low below the 5100s dip would be more concerning and bulls would need to see the 340dma hold on the 1 hour time frame or a test of 5k is on deck.
Bullish Above: $5800 - or breaking above that trendline resistance on volume
Bearish Below: $5350 - very bearish if falls below $5104
RISK TRADE: Accumulate/Scale a long position, up to the 1 hour pivot, $5355 looking for the breakout.
Don't forget to use stop losses!!!
Previous Articles:
BTCUSD
XMRUSD
ETHUSD
BTCUSD
DASHUSD
ZECUSD
BTCUSD
LTCUSD
Follow at your own risk, Not a financial adviser, understand the risks associated with trading and investing. Manage your own Risk - in other words you could lose it all and it's your own fault.


Bitcoin like skyrocket
Hey you bumped me from 1st place on the hot list ;)
if its any consolation i put you on my voter list ;-)
Haha thanks :-) Here's some funny stuff:
Hai my little Hazel Nut!
Hai babe :D how are you doing? Funny I was thinking of you today twice!
I just found Five Cognitive Biases Hurt Investors the Most in my inbox, by the almost always good looking infographics from the Visual Capitalist.
GIB FREE BTC TY
SURE!
As per chart its looking for a downward journey. but we should be cautious the support level.... Good Post and keep updating..... @vindy
I'm excited about the analyses and I think it's going over $6,000 next month.
How do I learn how to read the chart.? I enjoy watching BTCUSDT and would love to trade someday. I only use it when I need to buy stuff or other coin or icos
Thanks for that! Are you at trumpet player or just a fan?
If she plays BTC skyrockets ;)
good post @satchmo
Congratulations, your post received one of the top 10 most powerful upvotes in the last 12 hours. You received an upvote from @adsactly valued at 60.01 SBD, based on the pending payout at the time the data was extracted.
If you do not wish to receive these messages in future, reply with the word "stop".
stop
@satchmo
https://steemit.com/introductions/@theprettysoul/steemit-verification
Wishing you much continued success!!!
🎀@theprettysoul🎀