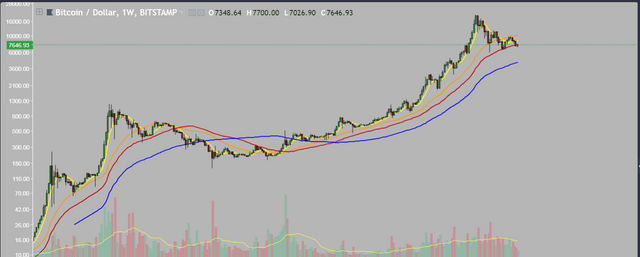
Bitcoin TA: June 2nd,
TA from a trusted source
BTC Update: On the weekly BTC chart I've got 4 moving averages. MA 7 (yellow), MA 30 (gold), MA 50 (red), and MA 100 (blue). If you zoom into the image you can see we broke below the 50 MA last week. However the MA 7 and MA 30 are about to curl down as well and look to be on the path of heading under 50 MA. Specifically the MA 7 is moving fast to get under MA 50. This is another indication of further downside ahead. Especially if the MA 30 (gold) curls under the 50 MA (red). I'd also like to direct your attention to the volume in 2014-2015. When we saw a long bear market we saw tall volume bars that highlight heavy selling for long consecutive weeks. This is typically called the capitulation phase in markets. Selling pressure intensifies and a lot of the players exit the market. This leaves prices down 70-90% from previous highs. If we were to have a similar kind of capitulation this market would be dragged out for months ahead until people become frustrated and the entire market just becomes boring. And then eventually we see a similar outcome of weeks of massive selling. Then and only then will the long bearish correction be finished. Again, this is IF we decide to keep up with our current pattern of not breaking previous highs and consistently creating lower highs from that $20k ATH.

