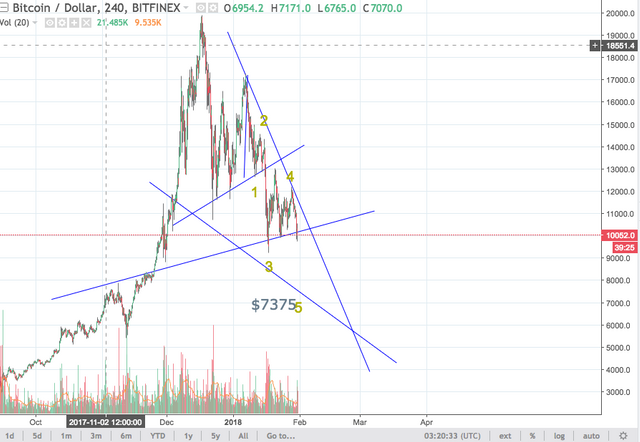
Bitcoin is heading down to 7k level
After the long correction that has been taken place, we are finally at a place to better call the bottom. The below chart shows the pathway of the 5 waves down. You can roughly tell the bottom pathway by the M top that has displayed itself on the 4h time period. The bottom of the middle point for the M is the support bar that if broken the downward trajectory can be estimated by the length of the highest peak of the M to the support line broken. This should help some with potential sell orders and those wondering to jump in or out. As always, the price could break below 7375, but that is the support line of the downward triangle.
Just my opinion and the price can go opposite. Do with it as you please, but don't take it as advice.
