Bitcoin Price Action 26/11/17
Last week I posted that there was a short term symmetric triangle formation in the Bitcoin price.
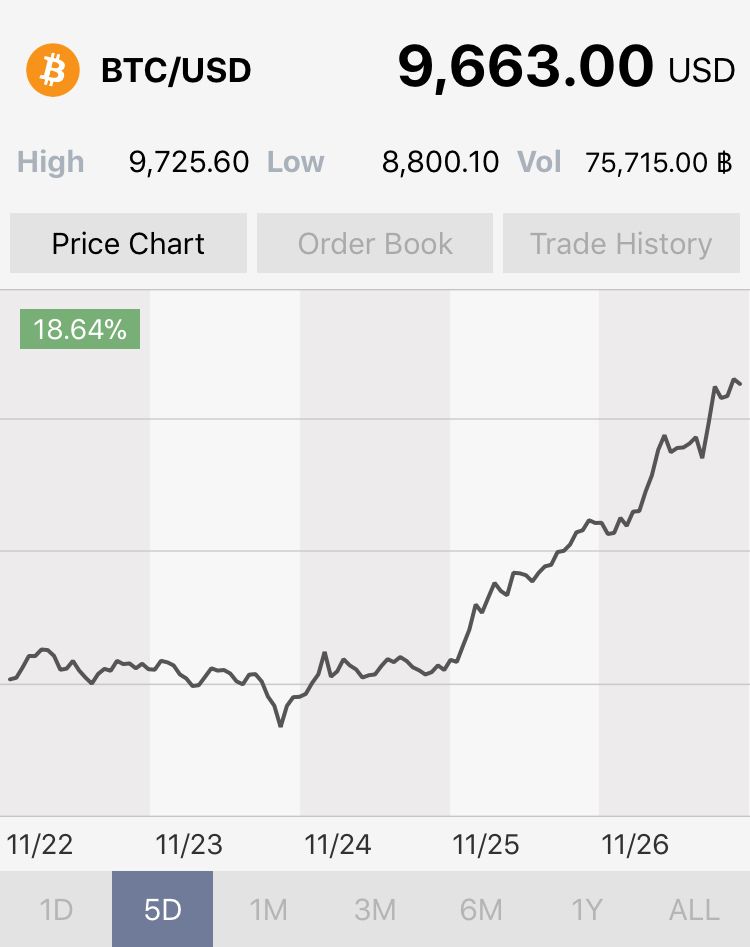
The price broke down from the triangle, quickly found support at a previous level of support around $7900.
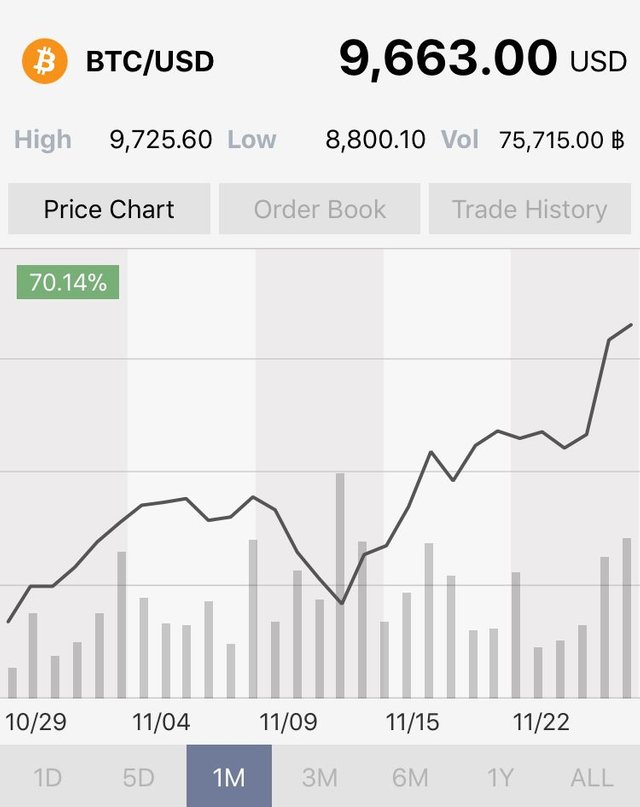
Since then the price never looked back and very quickly and steadily climbed to new all time highs.

Daily chart for the last month
For now it’s smooth sailing for the price up, watch for it to establish the high. Eventually the run up will run out of steam and pull back. But for now it’s upwards and onwards from here.
Possible next stop could be the $10,000 psychological barrier. I would expect it to make a red hot go at this target before any possible pull back. For now, enjoy the ride!
