Hold LONG POSITION / BITCOIN TRADING SYSTEM # 4
🐒 24hr VOLUME BTC / CRYPTO CURRENCY ( ALT COINS ) and BTC price comparison
I feel like a lot of Bitcoin when purchased goes to Bittrex or Poloniex in order to trade other Alt coins.
So I decided to start watching the 24hr volume of BTC traded on Bittrex and Poloniex to see how it correlates with the Bitcoin price.
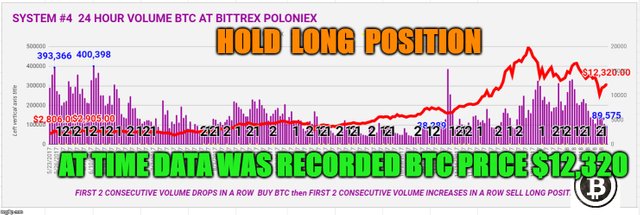
🐒 The 24hr volume BTC is the number of Bitcoins used to trade AltCoins on Bittrex and Poloniex .
🐒
CHART # 1:
PURPLE COLUMN = 24hr volume Bittrex / Poloniex combined
RED LINE = BTC PRICE from CoinBase trading platform GDAX
🐒
🐒 I may have isolated a possible chart pattern showing the possibility of Bitcoin rising in price . The pattern works like this when the first 2 consecutive days in a row the volume purple column falls ( they are marked with a BLACK # 1 ) When this happens it is a signal to Buy Bitcoin and then Sell the long Bitcoin position when the first 2 consecutive volume purple columns increase ( they are marked with a BLACK # 2 )
Below are the results of using this Buy and EXIT pattern.
BITCOIN TRADING SYSTEM # 4
| BUY DATE | BUY PRICE | SELL DATE | SELL | PROFIT / ( LOSS) | Cumulative P/L |
|---|---|---|---|---|---|
| 5/27/2017 | $ 2040 | 5/30/2017 | $ 2304 | $ 264 | $ 264 |
| 6/02/2017 | $ 2428 | 6/04/2017 | $ 2560 | $ 132 | $ 396 |
| 6/08/2017 | $ 2781 | 6/11/2017 | $ 2905 | $ 124 | $ 520 |
| 6/15/2017 | $ 2320 | 6/18/2017 | $ 2565 | $ 245 | $ 765 |
| 6/22/2017 | $ 2668 | 6/27/2017 | $ 2398 | ( - $ 270 ) | $ 495 |
| 7/01/2017 | $ 2503 | 7/04/2017 | $ 2597 | $ 94 | $ 589 |
| 7/07/2017 | $ 2582 | 7/29/2017 | $ 2705 | $ 123 | $ 712 |
| 7/31/2017 | $ 2754 | 8/02/2017 | $ 2720 | ( - $ 34 ) | 678 |
| 8/04/2017 | $ 2848 | 8/08/2017 | $ 3410 | $ 562 | $ 1240 |
| 8/13/2017 | $ 4082 | 8/18/2017 | $ 4338 | $ 256 | $ 1496 |
| 8/21/2017 | $ 4070 | 8/28/2017 | $4314 | $ 244 | $ 1740 |
| 9/07/2017 | $ 4606 | 9/13/2017 | $ 3853 | ( -$ 753 ) | $ 987 |
| 9/17/2017 | $ 3592 | 9/19/2017 | $ 4023 | $ 431 | $ 1418 |
| 9/21/2017 | $ 3890 | 9/26/2017 | $ 3938 | $ 48 | $ 1466 |
| 9/30/2017 | $ 4271 | 10/02/2017 | $ 4462 | $ 191 | $ 1657 |
| 10/04/2017 | $ 4251 | 10/10/2017 | $ 4800 | $ 549 | $ 2206 |
| 10/15/2017 | $ 5589 | 10/17/2017 | $ 5650 | $ 61 | $ 2267 |
| 10/19/2017 | $ 5688 | 10/30/2017 | $ 6188 | $ 500 | $ 2767 |
| 11/04/2017 | $ 7156 | 11/07/2017 | $ 7204 | $ 48 | $ 2815 |
| 11/14/2017 | $ 6532 | 11/17/2017 | $ 7834 | $ 1302 | $ 4117 |
| 11/19/2017 | $ 7758 | 11/21/2017 | $ 8229 | $ 471 | $ 4588 |
| 11/26/2017 | $ 9073 | 12/04/2017 | $ 11,245 | $ 2172 | $ 6760 |
| 12/09/2017 | $ 15,883 | 12/13/2017 | $ 17,250 | $ 1367 | $ 8127 |
| 12/23/2017 | $ 15,382 | 12/29/2017 | $ 14,389 | ( -$ 993 ) | $ 7194 |
| 1/01/2018 | $ 13,330 | 1/03/2018 | $ 14,908 | $ 1578 | $ 8772 |
| 1/07/2018 | $ 16,609 | 1/10/2018 | $ 14,121 | ( -$ 2,488 ) | $ 6284 |
| 1/12/2018 | $ 13,896 | 1/17/2018 | $ 10,181 | ( -$3,715 ) | $ 2569 |
| 1/19/2018 | $ 11,824 |
🐒 To date The BITCOIN TRADING SYSTEM # 4 has 27 trades 21 profits and 6 losses for an 77.77% accuracy and $2569 profit per Bitcoin traded.
🐒
DISCLAIMER :
This content is for informational, educational and research purposes only.
Please get the advice of a competent financial advisor before investing your money in any financial instrument.
It is strongly recommended that you consult with a licensed financial professional before using any information provided here . Any market data or news commentary used here is for illustrative and informational purposes only.
Trading involves a high level of risk. Future results can be dramatically different from the opinions expressed herein. Past performance does not guarantee future performance. Consult an investment professional before investing.
All ideas , trade signals , opinions and/or forecasts are for informational, educational and research purposes only and should not be construed as a recommendation to invest, trade, and/or speculate . Any investments made in light of these ideas, trade signals , opinions, and/or forecasts, expressed or implied herein, are committed at your own risk. I am not an investment advisor, information shared here is for informational, educational and research purposes only and not a recommendation to buy or sell anything .
🐒
Be sure to check out first thing every morning to see what the systems are doing that day.
Daily Bitcoin / Steem Trading Systems Update

🐒
Please voice your opinions in the comments below.
SUMMARY
🐒 Hold LONG POSITION using this system . All data is collected at 7:00 AM EST give or take a few minutes .
The Bitcoin price is from the Coinbase trading platform GDAX .


🐒 Hold LONG POSITION using this system
The Bitcoin price is from the Coinbase trading platform GDAX .
DISCLAIMER :
This content is for informational, educational and research purposes only.
Please get the advice of a competent financial advisor before investing your money in any financial instrument.
It is strongly recommended that you consult with a licensed financial professional before using any information provided here . Any market data or news commentary used here is for illustrative and informational purposes only.
Trading involves a high level of risk. Future results can be dramatically different from the opinions expressed herein. Past performance does not guarantee future performance. Consult an investment professional before investing.
All ideas , trade signals , opinions and/or forecasts are for informational, educational and research purposes only and should not be construed as a recommendation to invest, trade, and/or speculate . Any investments made in light of these ideas, trade signals, opinions, and/or forecasts, expressed or implied herein, are committed at your own risk. I am not an investment advisor, information shared here is for informational, educational and research purposes only and not a recommendation to buy or sell anything .
🐒
Hey man i like you strategy but i think there is an easyer way to track same thing.png)
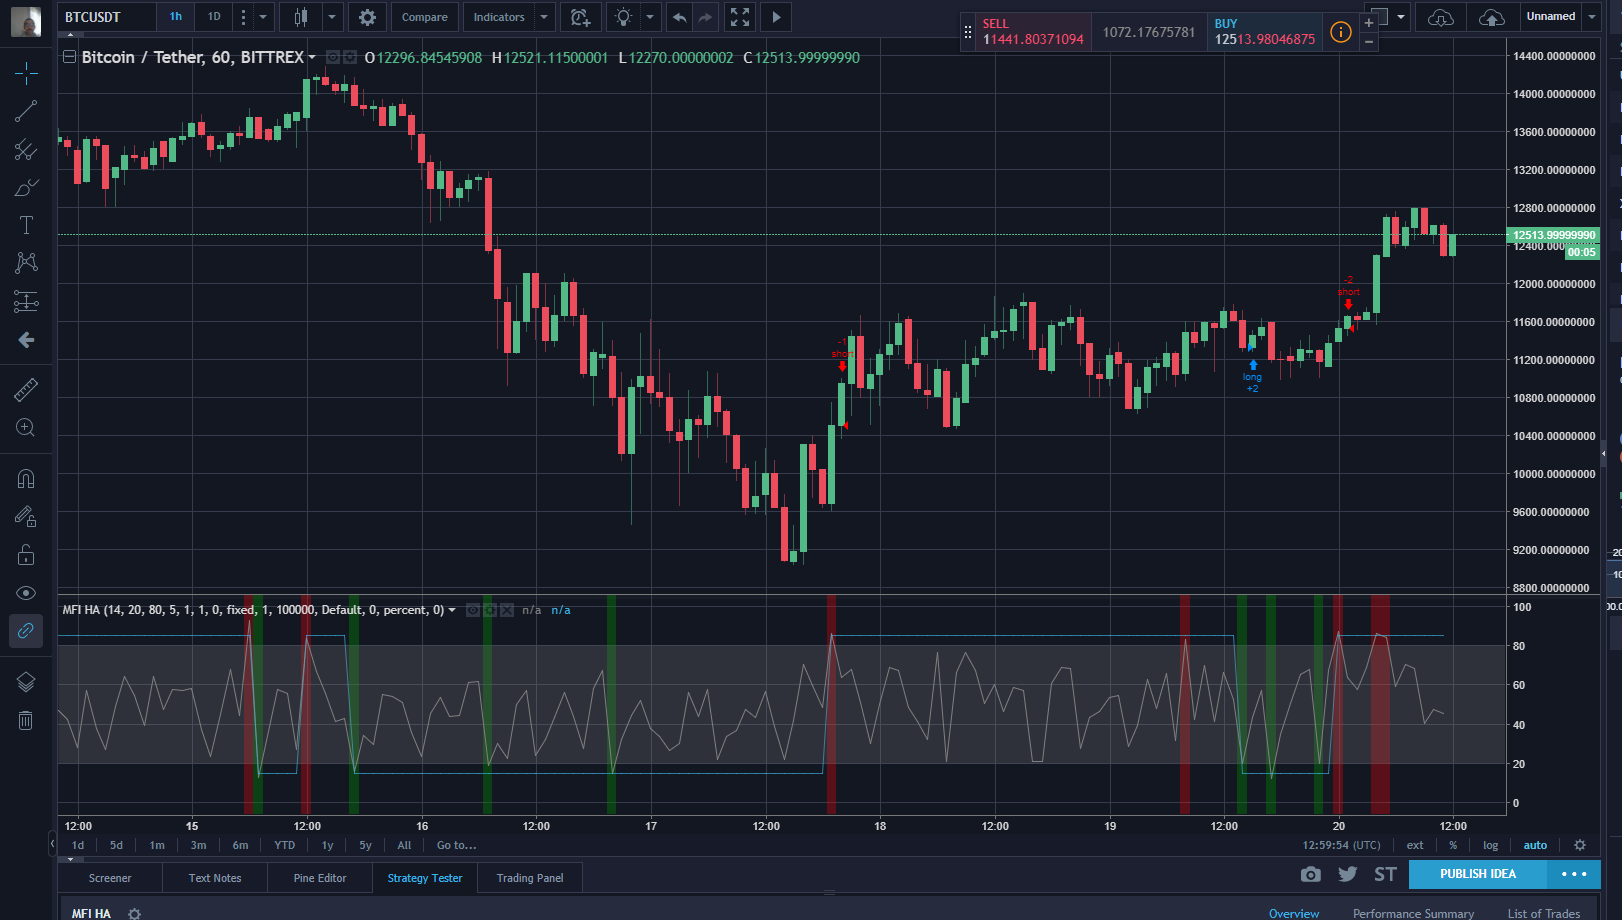
Practically what are you looking for is when BTC is oversold and overbought for that you can try MFI HA indicator for free on
https://www.tradingview.com
When is oversold you buy it, and when is overbought you sell it.
Happy trading !
And maby you should include https://www.binance.com/?ref=21826123 in your statistics because there a lot of people trade with altcoins and the market is growing faster and faster
🐒 Hold LONG POSITION using this system
The Bitcoin price is from the Coinbase trading platform GDAX .DISCLAIMER :
This content is for informational, educational and research purposes only.
Please get the advice of a competent financial advisor before investing your money in any financial instrument.
It is strongly recommended that you consult with a licensed financial professional before using any information provided here . Any market data or news commentary used here is for illustrative and informational purposes only.
Trading involves a high level of risk. Future results can be dramatically different from the opinions expressed herein. Past performance does not guarantee future performance. Consult an investment professional before investing.
All ideas , trade signals , opinions and/or forecasts are for informational, educational and research purposes only and should not be construed as a recommendation to invest, trade, and/or speculate . Any investments made in light of these ideas, trade signals, opinions, and/or forecasts, expressed or implied herein, are committed at your own risk. I am not an investment advisor, information shared here is for informational, educational and research purposes only and not a recommendation to buy or sell anything .
🐒
Nice article
Good post tarzan.Thanks for sharing @me-tarzan
thank's for sharing like this news...
@upvoted
nice post...
Hodl Hodl Hodl :)
ETH/USD
We expected the support zone between the trendline and $940 to hold. On Jan. 17, Ethereum broke below the trendline and fell to a low of $770.
The bulls bought the dip aggressively, which has resulted in a pullback that carried the cryptocurrency towards the 50 percent Fibonacci retracement levels of the recent fall from $1424 to $770.
For the past three days, the ETH/USD pair has been struggling to cross above $1097. If the price breaks out of the $1100 levels, we expect a move to $1174.36 and $1284.28 levels. As the stop loss is $930, which doesn’t offer a good risk to reward ratio, we are not suggesting any trade on it.