BTC Analitycs #1 | Always rallied when these 3 indicators aligned
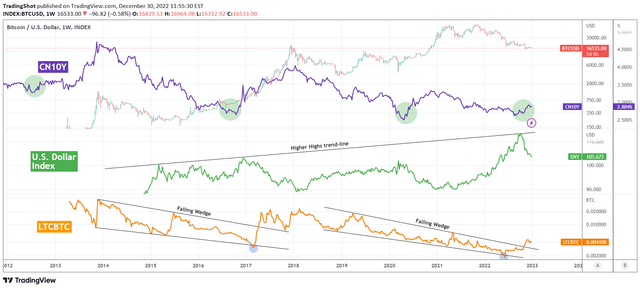
This is our last Bitcoin ( BTCUSD ) chart for 2022 and brings together the CN10Y (purple line), the U.S. Dollar Index (green trend-line) and the LTCBTC pair ( orange trend-line). We've mentioned countless times in the past the importance of the DXY on Bitcoin and the strong effect that Litecoin (LTC) has as a leading indicator. Recently we've also made cases of the strong correlation of China's Bond Yields with BTC .
This cross study brings together all three and compares their price action against BTC . As you see, since BTC's early days, every time the CN10Y made a V-shaped reversal and started to rebound breaking its Lower Highs trend-line, while the DXY started to fall after a rejection on its Higher Highs trend-line and the LTCBTC pair broke above its Falling Wedge , Bitcoin was in the early stages of a hyper aggressive rally.
With the stock markets not at their best but having posted a 2 month recovery, while the cryptocurrency market's credibility viciously hammered by the FTX and LUNA collapses, will this strong 3 indicator emergence be enough to put Bitcoin back into long-term bullish territory?
Thank you for reading to the end, if you like this post, be sure to follow me for more. If you find thi content relevant leave a upvote and resteem-it, it would be of great help.
