$6K in Sight? Bitcoin Price On Edge of Correction

Bitcoin looks set to revisit November lows after a 22 percent drop, but a minor corrective rally looks to be in the offing beforehand.
At time of writing, CoinDesk’s Bitcoin Price Index (BPI) is seen at $8,228, having clocked a five-week low of $7,676 earlier today. Meanwhile, BTC’s global average price on CoinMarketCap is $8,293 – down 7.44 percent in the last 24 hours.
Prices fell nearly $1,300 on Wednesday, a move reportedly influenced by Google’s decision to ban online advertisements promoting cryptocurrencies and related products. The restriction would come into effect from June.
However, even before the announcement from the search giant, the technical charts favored a downside move. The sell-off has sent BTC bulls packing and the cryptocurrency faces the risk of further downside in the days ahead.
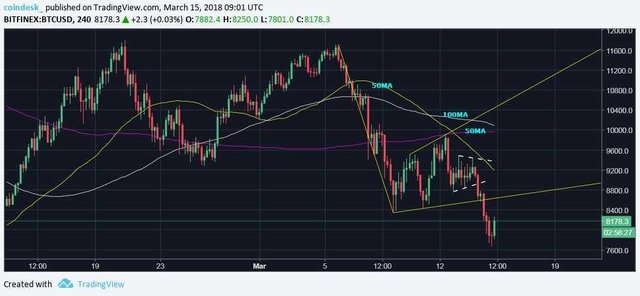
4-hour chart: Bear flag breakdown confirmed
Bitcoin fell below the flag support of $8,600 yesterday, signaling the sell-off from the recent high of $11,700 has resumed.

Accordingly, losses extended to lows below $7,700 today and could further decline to $5,500 (target as per the measured height method, discussed yesterday) in the next couple of weeks.
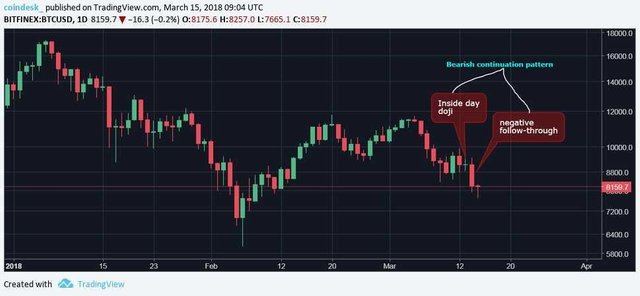
Daily chart: Bearish doji continuation pattern
Tuesday’s “inside day” doji candle highlighted bullish exhaustion around the critical double top neckline resistance (former support) of $9,280.
Further, Wednesday’s negative follow-through confirmed that the corrective rally from the March 9 low of $8,342 has ended and signaled a revival of the downtrend. The pattern only adds credence to the bear flag breakdown seen on the 4-hour chart.
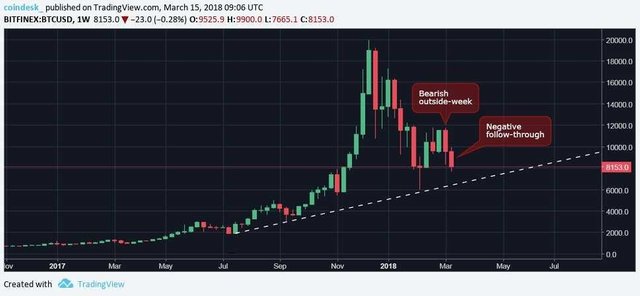
On the way lower, the cryptocurrency may encounter support at $6,410 (ascending trendline) and $6,000 as shown in the chart below.
Weekly chart (linear scale)

The ascending trendline drawn from the July 2017 low and September 2017 low could offer support around $6,410.
The February low of $6,000 could act as a strong support.
The bearish outside-week reversal confirmation indicates there is plenty scope for a drop to $6,000 (Feb low).
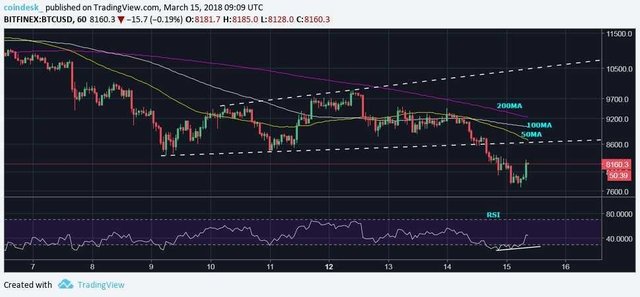
All that said, BTC may witness a minor relief rally, courtesy of the oversold conditions as shown by the hourly chart.
Hourly chart

The bullish price-relative strength index (RSI) divergence could push prices higher to $8,700 (hourly 50-MA) and possibly to $9,000 in the next 24 hours.
However, the rally will likely be short-lived as the moving averages are biased to the bears (sloping downwards).
View
BTC looks set to test $6,000 (February low) over the next week or two.
As of now, it appears the corrective rally will likely run out of steam in the range of $8,600 to $9,000 as the major moving averages – 50MA, 100MA, and 200-MA – on the 1-hour chart and 4-hour chart, are trending lower in favor of the bears.
The 10-day MA (currently seen at $9,204) is also biased to the bears. A daily close (as per UTC) above the 10-day MA would signal bullish invalidation and could yield short-term consolidation.
Meanhwhile, a daily close (as per UTC) above $11,700 would indicate a bearish-to-bullish trend change.
Hi! I am a robot. I just upvoted you! I found similar content that readers might be interested in:
https://finance.yahoo.com/news/6k-sight-bitcoin-price-edge-101553964.html