You are viewing a single comment's thread from:RE: Bitcoin: Walking the downtrendView the full contextView the direct parentluiggih (54)in #bitcoin • 7 years ago Here you have a quick gold's chart! Agree, big accumulation is going on
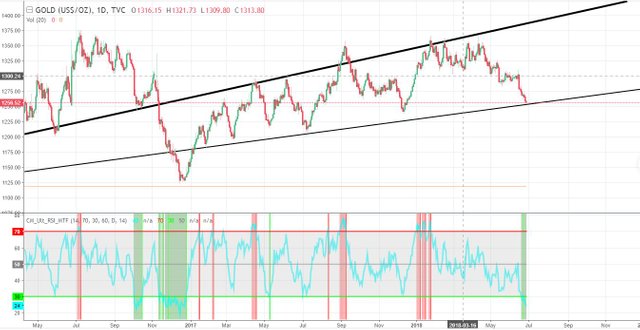
I haven't looked at an accumulation chart before. So when the curve crosses below 30 it means there is big accumulation or the opposite? Sorry for my ignorance.
Thank you for the charting!