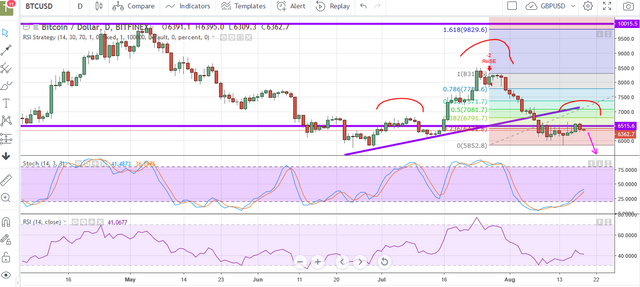
Bitcoin heading down...down...down
Cryptocurrency is definitely in a world of its own. In such a heavily manipulated market it's often hard to gauge what price is going to do. When you think price should go up based on good news it goes down and vice versa. All we can do is look at charts to see if we can identify possible patterns.
If we take a look at the daily Bitcoin chart above, price is currently toying with resistance at around $6,500 with a possible head & shoulders. For those who are unsure of what a head & shoulders pattern means it basically is a reversal pattern signaling the prior trend is reversing, or has already reversed. The head alerts traders that an uptrend is over and the price could head lower. Just a side note...The head and shoulders pattern can also be reversed if looking at a downtrend.
Bitcoin was ever so slighty in an uptrend as indicated by the diagonal trend line by which the left shoulder and head were formed and we are now seeing the right shoulder forming. From this, price could possibly drop initially to $5,800 being the neckline. As usual only time will tell how the world of bitcoin and its shenanigans plays out.
Remember Stay focused and treat trading as your business. Keep risk to a minimum and keep your emotions in check.
Happy Trading
Lanie

Hey @Lanietrades! Is this financial advice...or what???
Hey @citizenpresscorp,
As usual this is not financial advice as I am not a financial advisor. This is merely just my opinion along with a lesson on a possible chart pattern.
Thanks for the heads up
Lanie
4h stoch RSI at a good setting, we may go up a little then will see the hell...
You definitely could be right. I initially was looking at a retrace at Fib 382 being bang on $6,800. Still could happen then all indications point to carnage.