Bitcoin Has Finally Reached First Target To The Downside: 9000
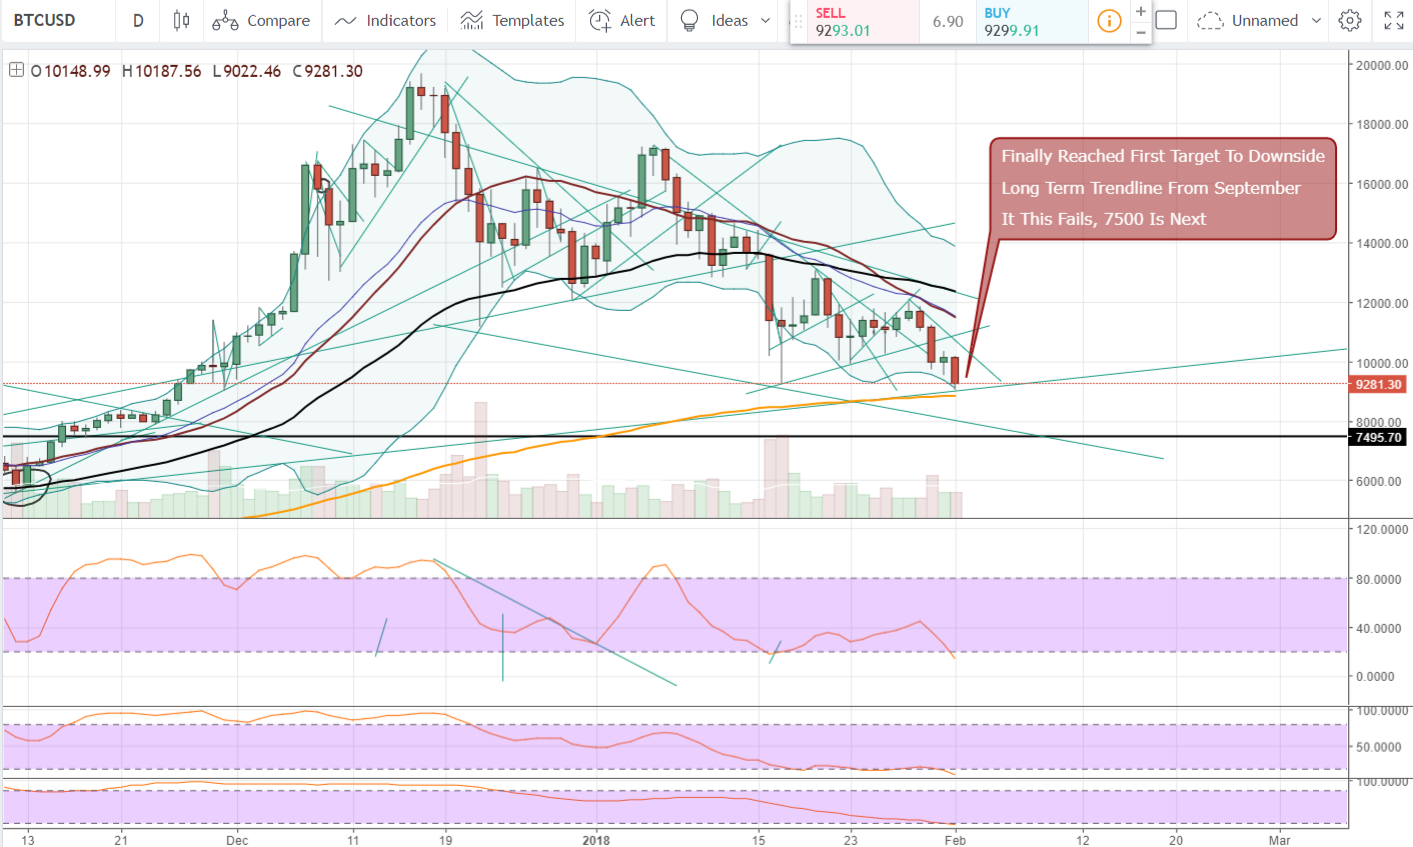
A couple of hours ago, Bitcoin went down and touched the long term trendline that goes all the way back to September of 2017. Here is the daily chart:
Comment: You can see the long term trendline in the image which is also aligned at the moment with the 200 day moving average (yellow line).
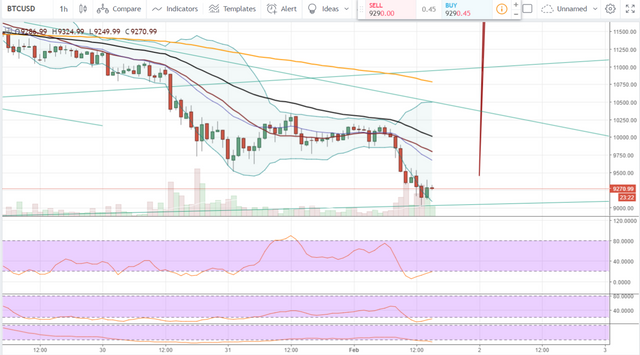
Lets have a look at the hourly chart:
Comment: Here we can clearly see that we touched the long term trendline where we have now bounced off from. We could get a bigger bounce from here, but it remains to be seen, we might retest it soon and if this trendline will not hold, we are most likely heading down to 7500 which is the most likely scenario here.
Happy investing!


Beautiful
Now bitcoin going to downside it may reach to 7000 in a month :)
It looks like on your chart $7,500 is the lower channel support. Hold you breath folks but HODL