Why Bitcoin Raimbow Chart is very important?
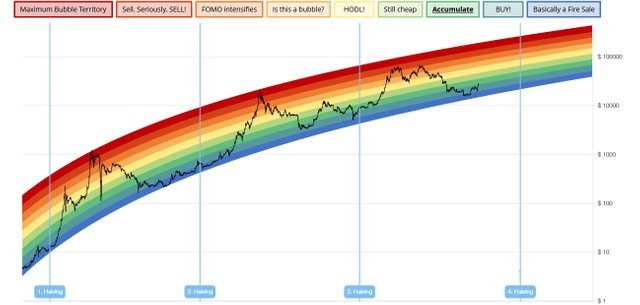
The Bitcoin Rainbow Chart is a visual representation of the historical price performance of Bitcoin over time. It was created by a trader named "Babak" and is based on a logarithmic scale that plots Bitcoin's price movements on a colored chart.
The chart consists of seven colored bands, each representing a different price range or market cycle. The colors range from deep red at the bottom of the chart, which represents the "bottom of the market," to bright green at the top.
The Bitcoin Rainbow Chart is often used by traders and investors to help identify market trends and potential buying or selling opportunities. However, it is important to note that it is based on past performance and is not a guarantee of future results.
