Bitcoin Cash: graph analysis
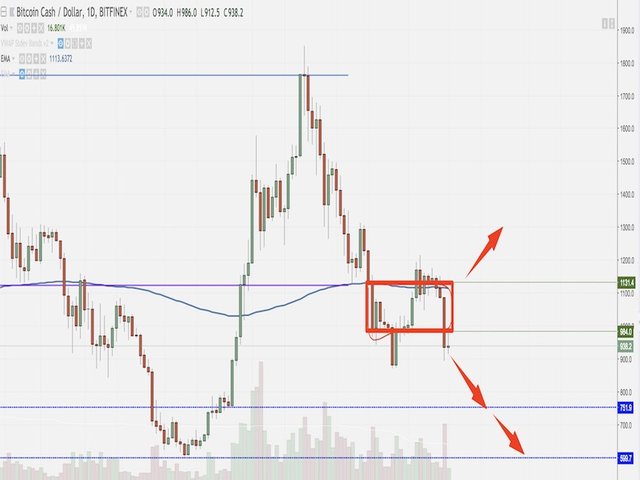
Bitcoin Cash (BCH) comes from three bad days and on 10 June the price opened in the area of 1086 dollars (on the relative highs of the day), and then started its downtrend up to 891 and closed in retracement to 934 dollars . The resistances to be monitored are: 2,210 and 1,761 dollars (61.8% level and 50% Fibonacci), while support lines: 600 and 750 dollars (monthly support).
For those wishing to buy Bitcoin Cash
Enter the confirmed break of the Fibonacci level in the area of 1,122 dollars, with a stop loss at 890 and the first target in the area of 1,761 dollars.
For those who currently hold Bitcoin Cash
Bearish entry opportunities as the price has broken down the static short-term channel.
For those wishing to sell Bitcoin Cash
For those who were not already entered, enter the break confirmed in the area 877 dollars, with a stop loss positioned at 1131 and the first target in the zone 750 and later at 600 dollars.
Target
Bearish
600: not reached
300: not reached
Bullish
1.120: reached April 20, 2018
1,757: not achieved
Go here https://steemit.com/@a-a-a to get your post resteemed to over 72,000 followers.