BTC Update: 2-5-18
Price: ~$8,200
In last week’s weekly update I had concluded with saying, “Price staying inside the daily cloud & price staying above & pushing past the weekly Tenkan” were important feats for bulls to achieve for the coming week ahead. Unfortunately, price was able to achieve neither.
24HR:
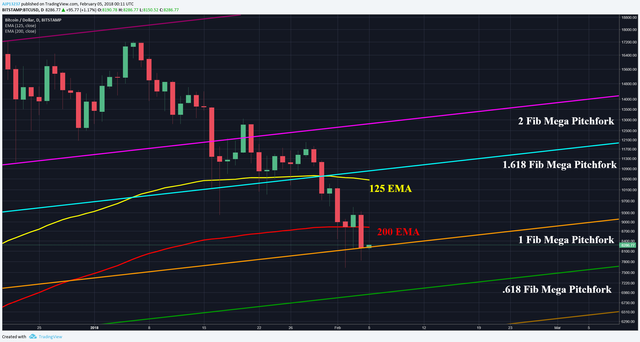
In the last BTC update I had also mentioned that "The longer price stalls around the 200 EMA, the more likely a retest ranging between the local bottom ($7.6K) & the 1 Fib ($8.2K) becomes." After a few days of meandering around the 200 EMA, it finally gave out again and for the first time since 2015, BTC closed beneath the 200 EMA. Currently price has been caught by the 1 Fib, but it’s to be determined if this support will hold.
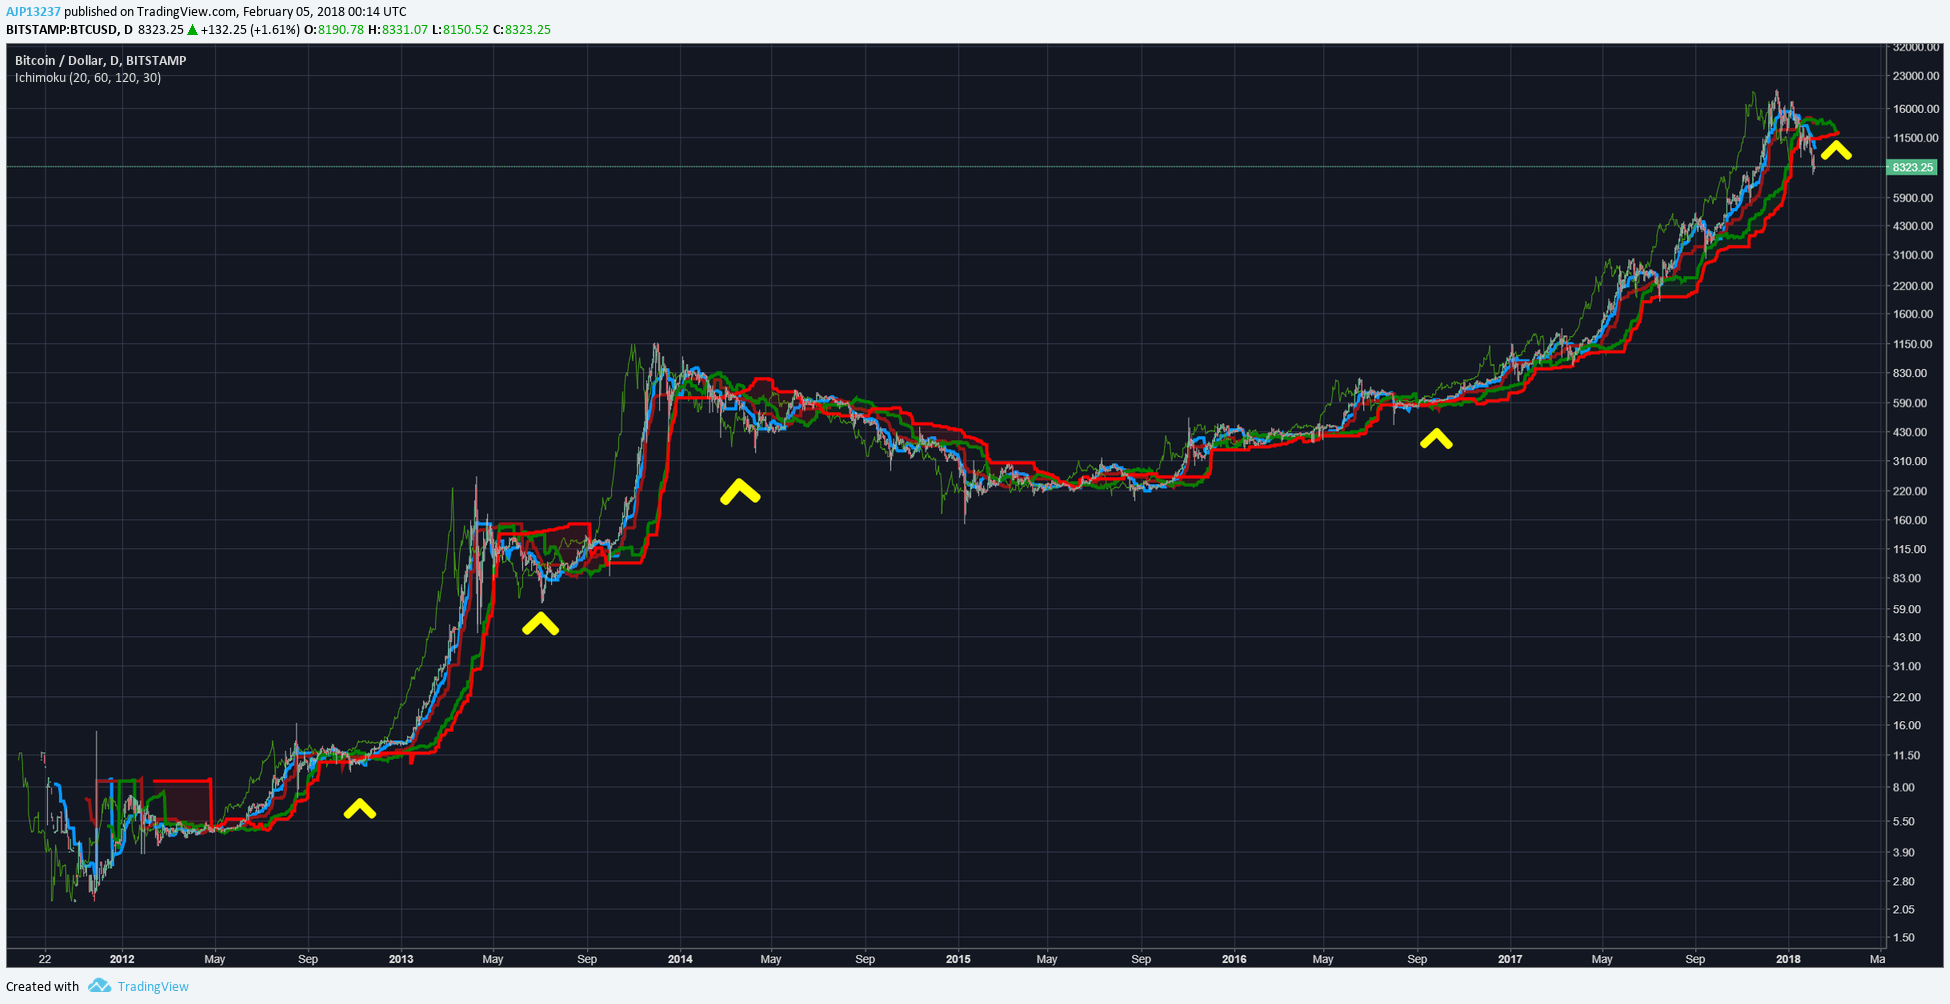
Today is also the first time that the daily cloud has twisted bearish since late 2016. Below are the other instances where the daily cloud has flipped bearish. It’s to be determined if this will spell out an extended bear market, as this has only happened in 2014, however the theme has been an extended sideways at the bare minimum.
Weekly:
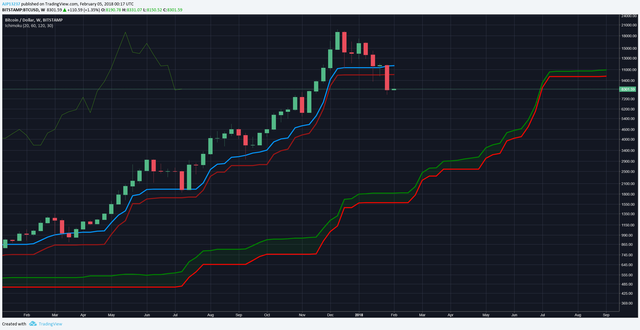
As I alluded to above, it was important for the weekly candle close to make a move upwards to avoid creating resistances. This did not happen and now the Tenkan & Kijun will be resistance in the $10-12K range.
Fibonacci Retracement:
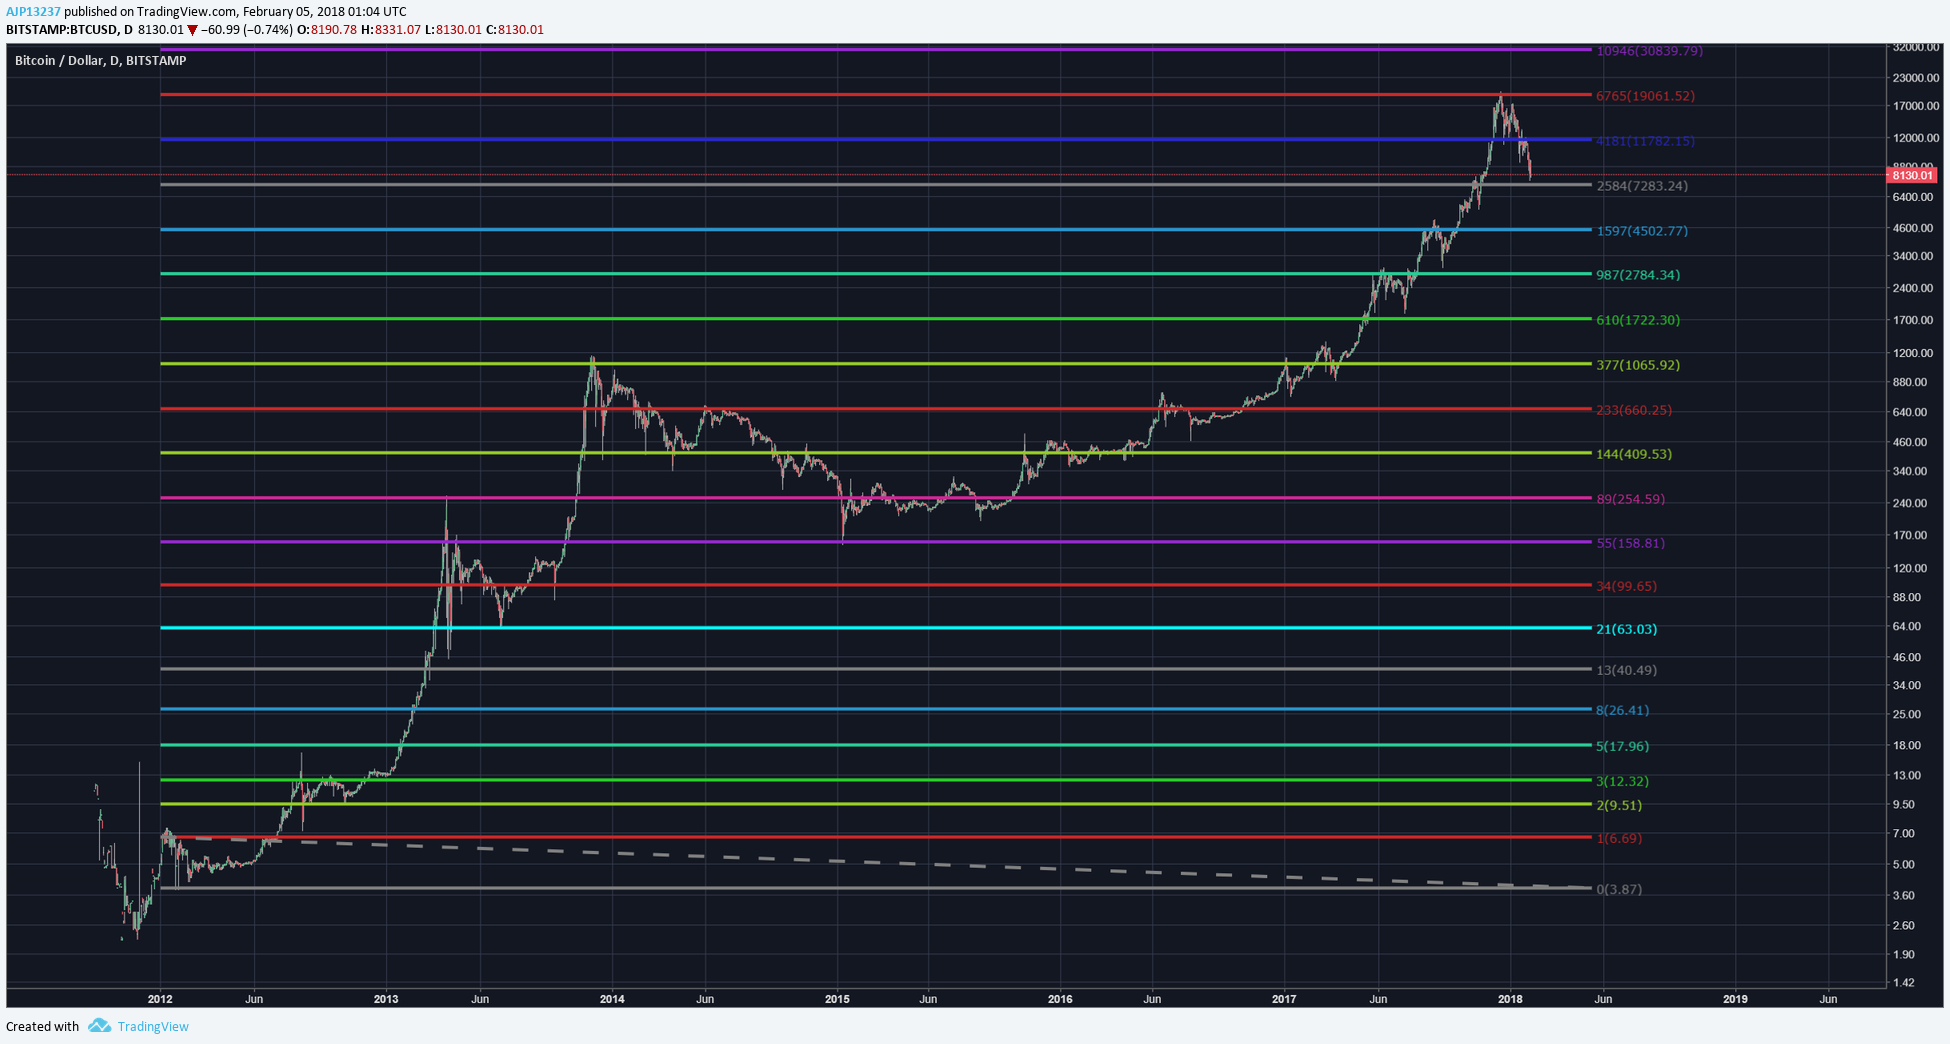
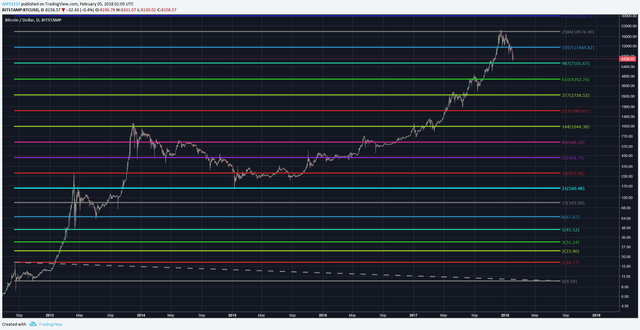
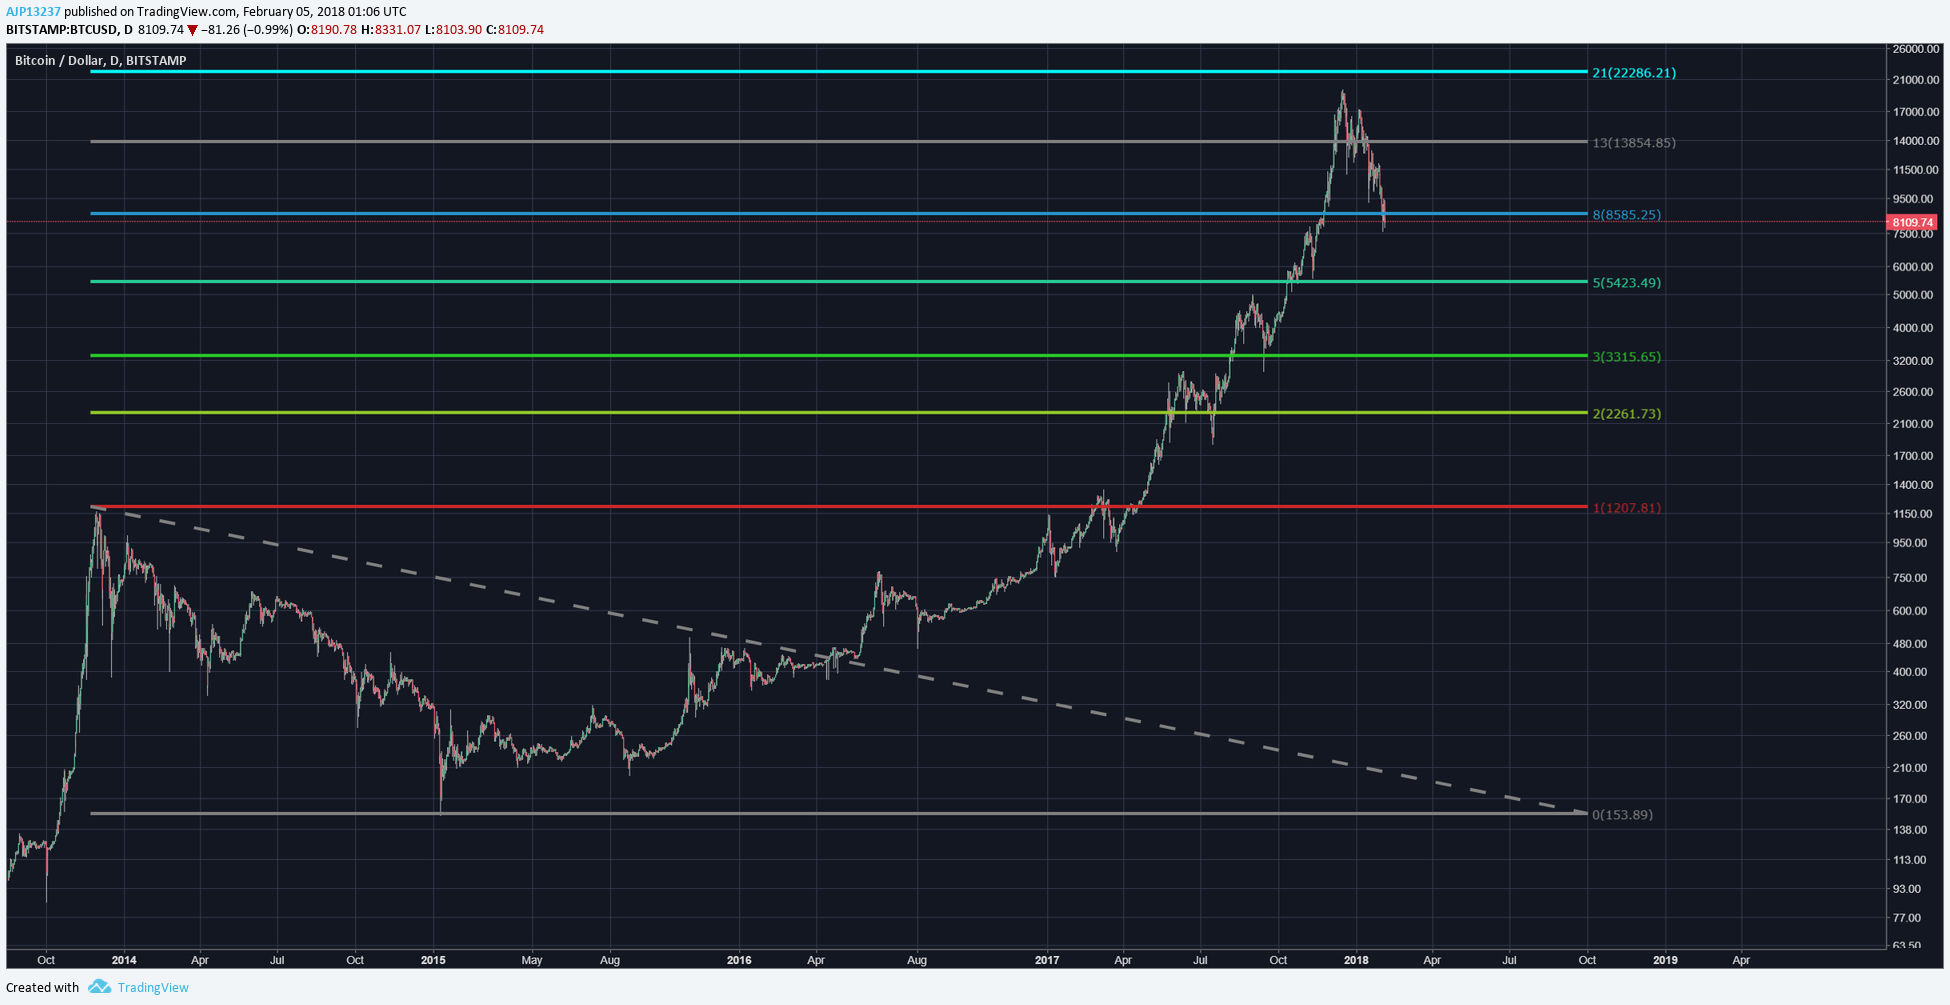
Below are Fibonacci Retracements drawn in order of Bitcoin’s inception to each major pullback. The common theme between these is to illustrate that BTC has broken a fib level, not something done during the entirety of the Bull Run. Further, confirming that BTC is at a bare minimum going to be stuck in sideways consolidation for a bit. In the event it breaks another fib, which is currently hovering around, this will likely be a signal that the Bull Run is officially over and a bear market will be in full force.
Prognosis:
BTC continues to break key supports, with the latest being the 200 EMA. For bulls to have a fighting chance of a reversal, this will be the first support necessary to recapture. The longer BTC stays under the 200 EMA the more likely more downward price action will take place.
If you found this useful & educational, please like, share, & follow.
steemit: @ dogevader
twitter: @ Noob_Charts
Finally, if you have any questions or comments, leave them below & happy trading!
Excellent analysis, as usual.
Thanks
thanks