2014 vs 2018 Bitcoin Price Correction: This Year Will Likely be Significantly Shorter
2014 and 2018 is Very Similar
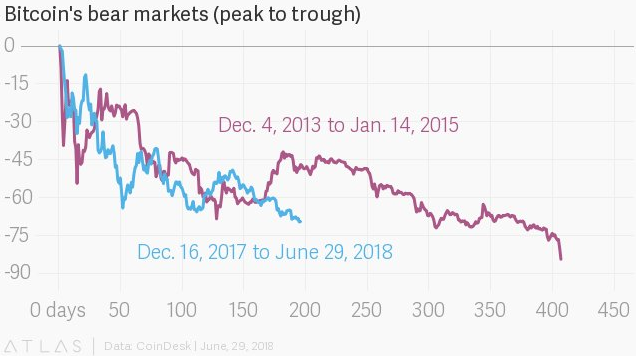
From December 4, 2013, to January 4, 2015, in a 400-day period, the bitcoin price dropped by over 80 percent, recording the worst correction in its history. The mid-term decline in the price of bitcoin was prolonged by a four-month period during which BTC rebounded to its previous support level and remained above that level before inevitably falling by more than 80 percent.
In 2014, it took bitcoin 300 days to drop by more than 70 percent. In 2018, it took BTC less than 200 days to decline by over 72 percent and in contrast to its correction in 2014, BTC is falling significantly faster than it did four years ago.
If the price chart of bitcoin year-to-date is compared with the price chart of bitcoin from December, 2013 to January, 2015, with the chart of BTC from 2013 to 2015 compressed, the price trend of BTC seem nearly identical to its price trend in 2014 with one key difference: speed.
Purely based on the price trend of BTC year-to-date and the price trend of BTC in 2014, BTC is experiencing a faster version of the 2014 correction. It has experienced similar drops and corrective rallies in similar timing, and it is now on track to decline further to bottom out at a stable region.
If the chart of bitcoin year-to-date and the compressed chart of BTC in 2014 are compared as seen below, many similarities can be detected.

Hi! I am a robot. I just upvoted you! I found similar content that readers might be interested in:
https://www.ccn.com/2014-vs-2018-bitcoin-price-correction-this-year-will-likely-be-significantly-shorter/
upvote for me please? https://steemit.com/news/@bible.com/6h36cq