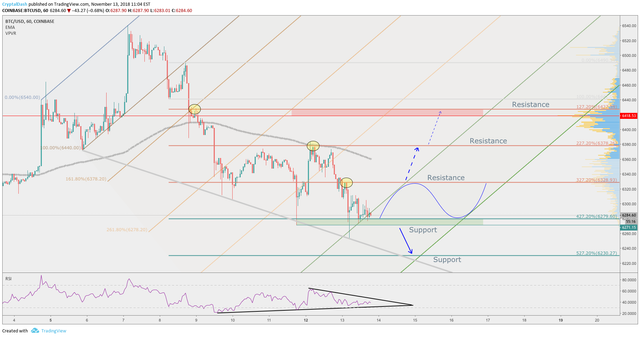
How far the price of Bitcoin will drop?
Today Bitcoin has tested the support at $6280, which previously has been rejected. This is a 427.2% Fibonacci retracement level applied to the corrective wave after the ascending channel breakout. BTC/USD still struggling to break below the support which might result in a consolidation between the $6280 and $6330 levels.
While the price is stuck between the support and resistance , trend is considered sideways. Although it is reasonable to wait for the breakout, either above the $6330 resistance or below the $6270 support.
Break below the support at this point seems to be more probable, since the trend is clearly bearish . In this scenario, price would reach next Fibonacci retracement level at $6230. But if it breaks above the resistance, more gains can be expected. BTC then could rise towards the $6380 or $6420 level, confided by the 127.2% Fibs, along with the price where the most trading volume had been generated previously.
See the latest prices across multiple exchanges at https://www.cryptaldash.com

Hi! I am a robot. I just upvoted you! I found similar content that readers might be interested in:
https://www.tradingview.com/chart/BTCUSD/vhsiOGrj-How-far-the-price-of-Bitcoin-will-drop/